1
TGGE System
52
•
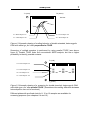
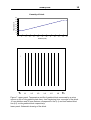
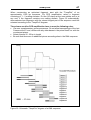
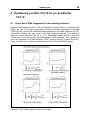
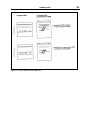
Predicted relative gel mobility as calculated according to Lerman et al., as a
graph vs. temperature for different values of the 'retardation length' parameter.
This plot can be used for direct comparison with TGGE experiments;
superpositions of plots generated with or without mismatched positions given
are
useful as a hint whether specific mismatched duplexes could be detected
among homoduplexed DNA in a mixture of sample and reference double
strands having undergone a denaturation-renaturation cycle, using either
perpendicular or parallel TGGE.
• A 'half-denaturation temperature' plot showing the half-denaturation
temperature for each base. This plot can also be used to estimate the
destabilizing effect of mismatches on the surrounding part of the sequence: a
temperatureshift of the TGGE transition can be expected if the lowest melting part of the
sequence is directly affected by the mismatch!
Calculations can be done for oligonucleotides (>15 bases) or long double strands
(>50 bases), respectively. In the case of oligonucleotide mode, a length-dependent
correction for the strand dissociation process is applied; the temperature range is
adapted as well. We do not have sufficient experimental results to stringently check
for this mode to give valid results, but for the length range of about 20 nucleotides
there is at least experimental evidence. Using 'oligo' mode with far longer sequences
gives misleading results!
Graphics output is possible in Postscript, HPGL, GIF and PBM format, numeric
results are available as well. All graphics results are directly sent to the WWW client,
for GIF inline images and pbm images links are provided to retrieve a copy for the
external viewer (or for download to disk).