1
SVAN 953 USER MANUAL
_
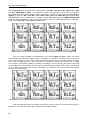
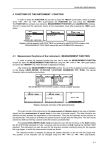
and 1/1 OCTAVE mode the name of the measurement result (SPL, LEQ, SEL, Lden, LEPd, Ltm3, Ltm5,
Lxx, OVL, PEAK, MAX and MIN – cf. the definitions in App. D) is presented in the first line of the display.
Next, either the detector (path: MENU / INPUT / PROFILE x / DETECTOR) time constant (Fast, Slow or
Impulse) is given for SPL, LEQ, SEL, Lden, LEPd, Ltm3, Ltm5, Lxx, MAX, MIN results (when RMS
INTEGRATION is set to exponential) or indicator of linear RMS integration (Lin.) RMS INTEGRATION
(when the RMS integration is set to linear (path: MENU / SETUP / RMS INTEGRATION: LINEAR)) in the case of LEQ, SEL, Lden, LEPd and Lxx results.
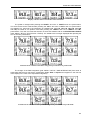
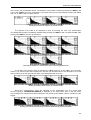
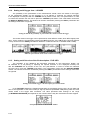
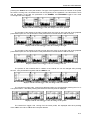
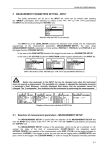
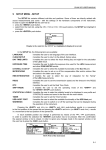
Measurement results in LEVEL METER made with linear integration, presented in one profile mode
There is not any indication of the detector in the case of PEAK and OVL results. The name
of the implemented filter (path: MENU / INPUT / PROFILE x / FILTER) is presented as the last element
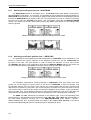
of the first line (A, C or Z). The result of the measurement together with its unit (dB for almost all results
and % only for OVL) is given in the second line. The profile, the results are coming from, is visible
in the bottom of the display (Profile(1), Profile(2) or Profile(3)). The line showing the value of the result
in the analogue-like form together with the scale is presented at the left side of the display. The real time
clock is visible in the bottom right corner of the display. The selection of the result is made by pressing
the <>, <> push-buttons.
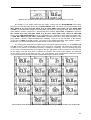
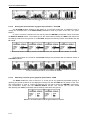
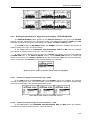
Measurement results in LEVEL METER made with exponential integration, presented in one profile mode
If the measurement results are saved in the internal memory in a file or the AUTO SAVE option is
switched on, the name of the file is presented under the profile’s number.
6-2