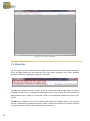
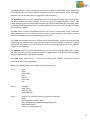
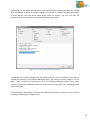
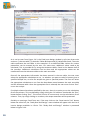
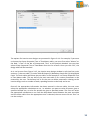
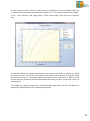
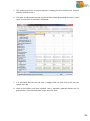
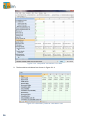
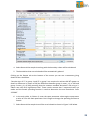
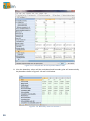
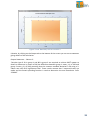
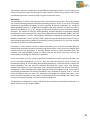
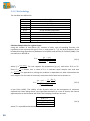
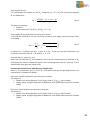
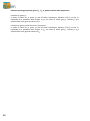
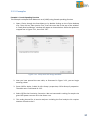
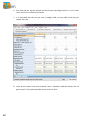
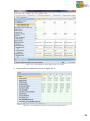
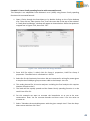
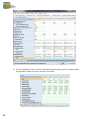
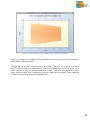
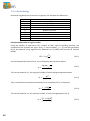
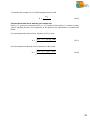
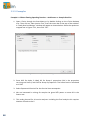
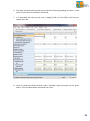
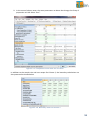
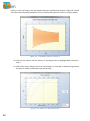
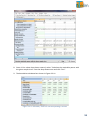
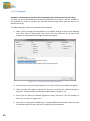
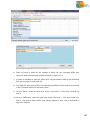
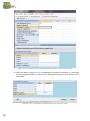
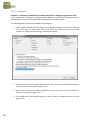
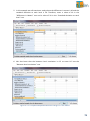
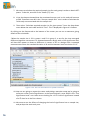
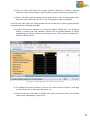
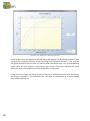
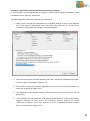
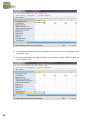
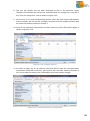
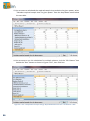
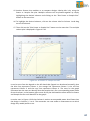
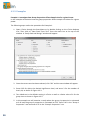
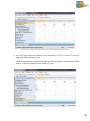
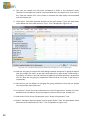
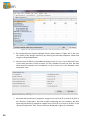
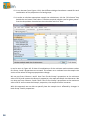
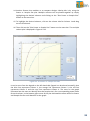
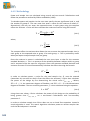
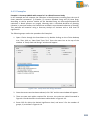
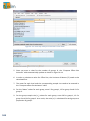
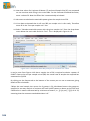
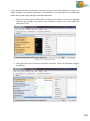
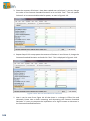
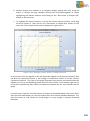
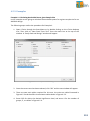
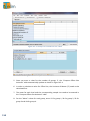
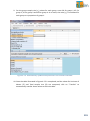
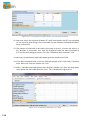
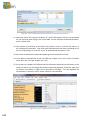
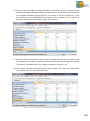
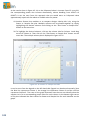
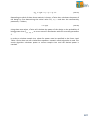
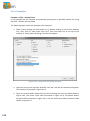
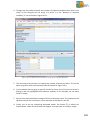
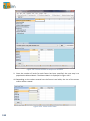
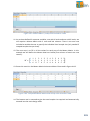
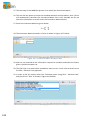
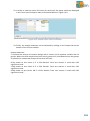
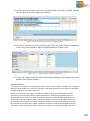
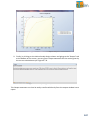
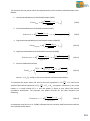
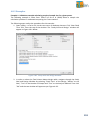
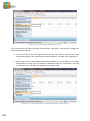
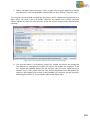
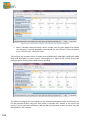
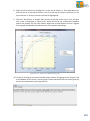
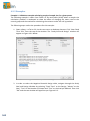
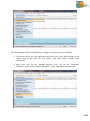
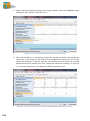
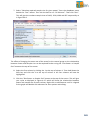
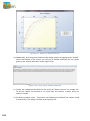
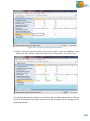
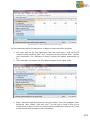
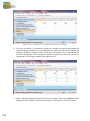
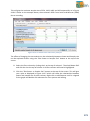
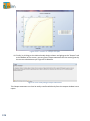
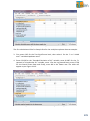
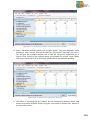
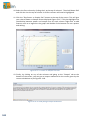
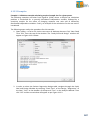
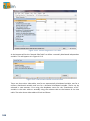
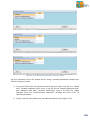
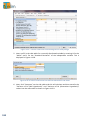
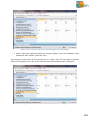
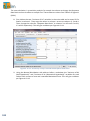
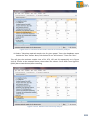
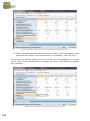
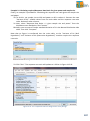
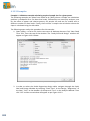
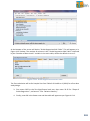
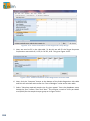
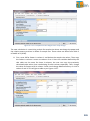
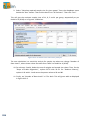
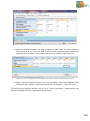
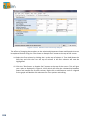
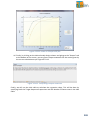
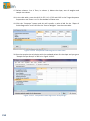
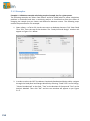
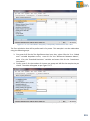
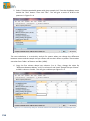
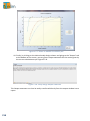
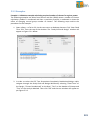
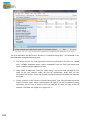
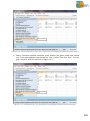
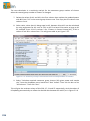
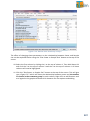
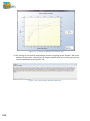
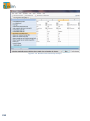
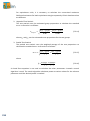
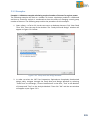
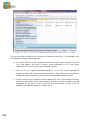
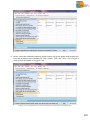
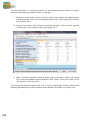
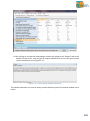
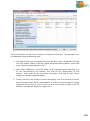
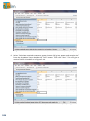
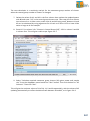
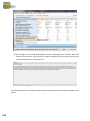
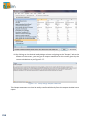
Figure 3.3.3. Complete Survival Table for One test
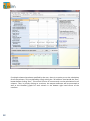
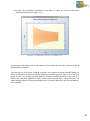
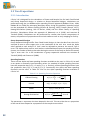
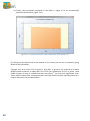
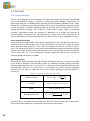
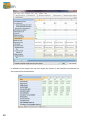
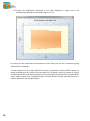
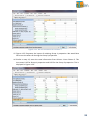
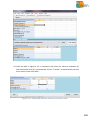
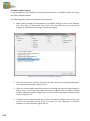
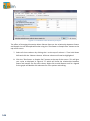
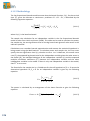
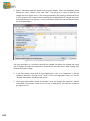
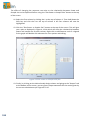
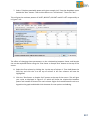
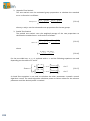
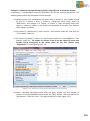
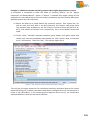
In addition to the sample size and cost output for Column 1, the boundary calculations are
also presented as shown below.
Figure 3.3.4. Boundary Table for Column 1
50