1
DATA ANALYSIS IN VMD
VMD is a powerful tool for analysis of structures and trajectories. Numerous tools for
analysis are available under the VMD Main menu item Extension → Analysis. In addition
to these built-in tools, VMD users often use custom-written scripts to analyze desired
properties of the simulated systems. VMD Tcl scripting capabilities are very extensive,
and provide boundless opportunities for analysis. In this section, we will learn how to
use built-in VMD features for standard analysis, as well as consider a simple example of
scripting.
Necessary Resources
Hardware
Computer
Software
VMD, a text editor, and a plotting application
Files
ubiquitin.psf, pulling.dcd, equilibration.dcd and distance.
tcl, which can be downloaded at http://www.currentprotocols.com
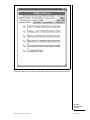
Adding Labels in VMD
Labels can be placed in VMD to get information on a particular selection, to be used
during visualization and quantitative analysis. Labels are selected with the mouse and
can be accessed in Graphics → Labels menu. We will cover labels that can be placed
on atoms and bonds, although angle and dihedral labelings are also available. In this
context, labels for “bonds” or “angles” actually mean distances between two atoms or
angles between three atoms, the atoms do not have to be physically connected by bonds
in the molecule.
BASIC
PROTOCOL 14
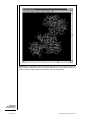
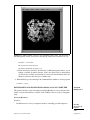
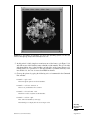
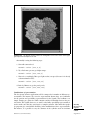
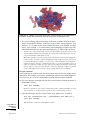
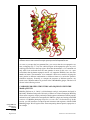
1. Start a new VMD session. Load the ubiquitin trajectory into VMD (using the Þles
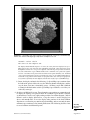
ubiquitin.psf and pulling.dcd). For graphical representation, display protein only, using NewCartoon for drawing method and Structure for coloring method.
If you need help, see Basic Protocol 3, steps 1 to 6.
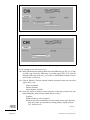
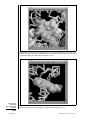
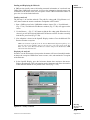
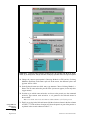
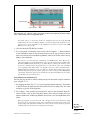
2. Choose the Mouse → Labels → Atoms menu item from the VMD Main menu. The
mouse is now set to the mode for displaying atom labels. You can click on any atom
on your molecule and a label will be placed for this atom. Clicking again on it will
erase the label.
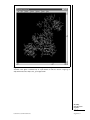
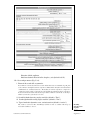
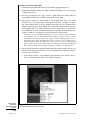
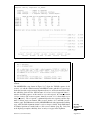
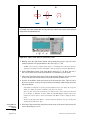
3. We will now try the same for bonds. Choose the Mouse → Label → Bonds menu
item from the VMD Main menu. This selects the Display Label for Bond mode.
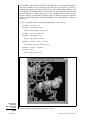
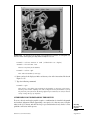
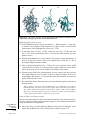
We will consider the distance between the α carbon of Lysine 48 and of the C terminus.
In the pulling simulation, the former is kept fixed, and the latter is pulled at a constant
force of 500 pN. In reality, polyubiquitin chains can be linked by a connection between the
C terminus of one ubiquitin molecule and the Lysine 48 of the next. The simulation then
mimics the effect of pulling on the C terminus with this kind of linkage.
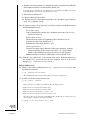
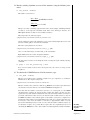
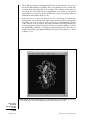
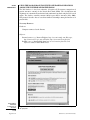
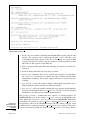
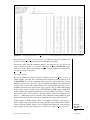
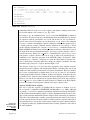
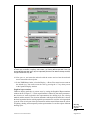
4. Open the TkConsole window by selecting Extensions → Tk Console in the VMD
Main menu. We will make a VDW representation for the α carbons of Lysine 48 and
of the C terminus. To Þnd out the indices of these atoms, make a selection including
these two atoms by typing in the TkConsole window:
set sel [atomselect top ‘‘resid 48 76 and name CA’’]
Modeling
Structure from
Sequence
5.7.39
Current Protocols in Bioinformatics
Supplement 24