1
Chapter 4
Using Port Statistics
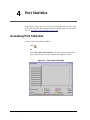
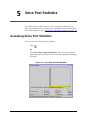
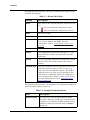
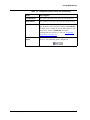
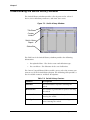
The Port Statistics window allows you to see the data passing through
each port in the network. For an explanation of the Port Statistics
window, refer to “Understanding the Port Statistics Window” on
page 35.
Using Port Statistics you can:
•
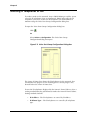
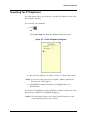
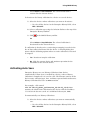
Select the ports and LAGs you want SMON to monitor. For
information on selecting ports and LAGs to monitor, refer to
“Selecting Ports and LAGs to Poll” on page 37.
•
Select the ports and LAGs you want SMON to display. For
information on changing display options, refer to “Filtering the
Port Statistics Display” on page 39.
•
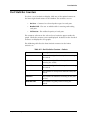
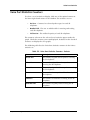
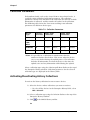
Select the counters you want SMON to display. For information
on selecting counters, refer to “Port Statistics Counters” on
page 42.
•
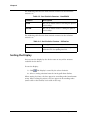
Sort the display. For more information on sorting the display,
refer to “Sorting the Display” on page 43.
•
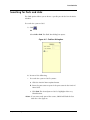
Search for specific ports and LAGs. For more information, refer to
“Searching for Ports and LAGs” on page 44.
Understanding the Port Statistics Window
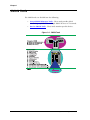
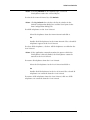
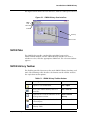
The Port Statistics window is organized as follows:
35
•
The X axis represents packets or percentage of utilization.
•
The Y axis represents ports and LAGs. Each row on the graph
corresponding to a port or LAG is labeled on the Y axis with a port
number, LAG number, or with the user defined name of a port.
•
An asterisk (*) following the name of a port or LAG indicates
that extra information about the port is available in the port’s Info
Box.
Avaya SMON Manager User Guide