1
Low Level Calibration and Measurement
1.
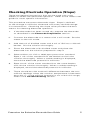
Add 100 mL of distilled water and 1 mL of low level ISA to a
150 mL beaker.
2. Rinse the electrode with distilled water, blot it dry and place
it into the beaker. Stir the solution thoroughly.
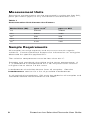
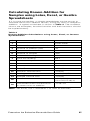
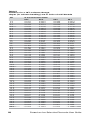
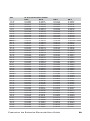
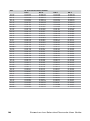
3. Add increments of the 100 ppm or 10-3 M potassium
standard to the beaker using the steps outlined in Table 2.
Record the stable millivolt reading after each increment.
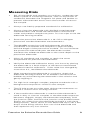
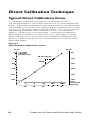
4. On semi-logarithmic paper, plot the concentration (log axis)
against the millivolt potential (linear axis). Prepare a new
calibration curve with fresh standards each day.
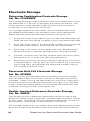
5. Measure 100 mL of sample and 1 mL of low level ISA
and pour the solutions into a clean 150 mL beaker. Rinse
the electrode with distilled water, blot it dry and place the
electrode into the sample.
6. Stir the solution thoroughly. When a stable reading is
displayed, record the mV value.
7.
Determine the sample concentration corresponding to the
measured potential from the low level calibration curve.
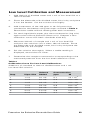
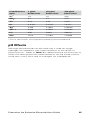
Table 2
Calibration Curve For Low Level Calibrations
Additions of standard to 100 mL distilled water and 1 mL
low level ISA solution.
Step
Pipet Size
Volume
Added
Concentration
ppm
M
1
1 mL
0.1 mL
0.1
1.0 x 10⁻⁶
2
1 mL
0.1 mL
0.2
2.0 x 10⁻⁶
3
1 mL
0.2 mL
0.4
3.9 x 10⁻⁶
4
1 mL
0.2 mL
0.6
5.9 x 10⁻⁶
5
1 mL
0.4 mL
1.0
9.8 x 10⁻⁶
6
2 mL
2.0 mL
2.9
2.9 x 10⁻⁵
7
2 mL
2.0 mL
4.7
4.7 x 10⁻⁵
Potassium Ion Selective Electrode User Guide
23