1
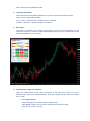
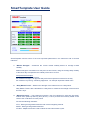
AMA - Moving average based indicator. 4. Legend at the bottom This shows the list of indicators displayed on the chart and the corresponding colours: Colours can be interpreted as follow: ATCI – Green = Uptrend, Red = Downtrend, Grey = Neutral. ATLDiG – Light blue = Uptrend, Orange = Downtrend 5. Bar charts: The colour of the bars on the charts is showing the trend of the four indicators, for the selected chart period. Please note that SmartTemplate should only be used with Bar Charts and not Candlesticks or Line Charts) 6. Interpretation, usage and example: When the “Daily Market Trend” value corresponds to the long term “Trend” of the four indicators we wait for a low “Market Strength” value and a signal from the short and medium term “Trend”. For Long positions: “Market Strength” is at 10-20 (in dark or medium blue). “Daily Market Trend” is up (in yellow or orange on the right hand side). In D1-W1 the “Trend” is “Long”.