1
18
DIMENSION REDUCTION AND GROUPING
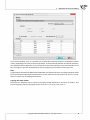
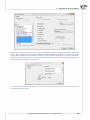
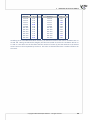
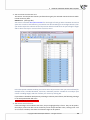
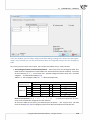
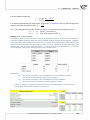
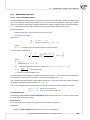
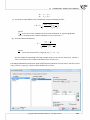
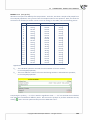
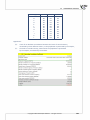
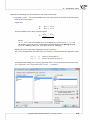
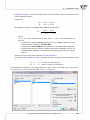
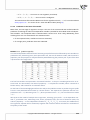
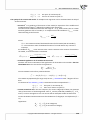
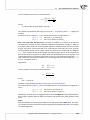
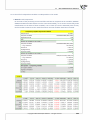
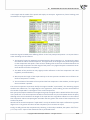
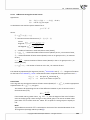
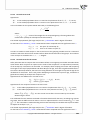
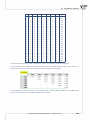
In order to be able to use the two ini al components instead of the previous four original values, we
copy and paste them into the data sheet. Now, the researcher can conduct the further sta s cs on two
new, uncorrelated variables.
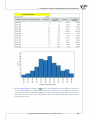
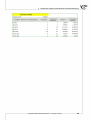
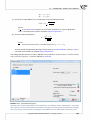
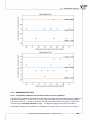
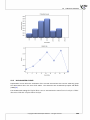
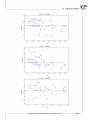
Analysis of the graphs of the two ini al components
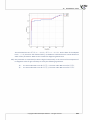
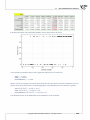
The analysis of the graphs not only leads the researcher to the same conclusions as the analysis
of the tables but will also give him or her the opportunity to evaluate the results more closely.
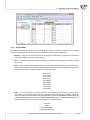
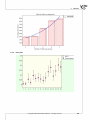
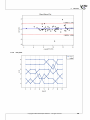
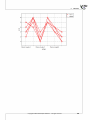
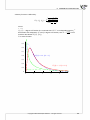
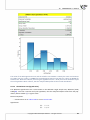
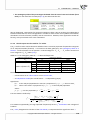
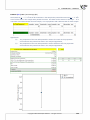
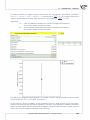
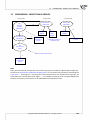
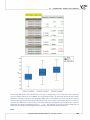
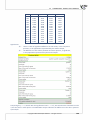
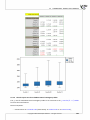
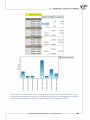
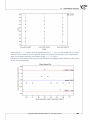
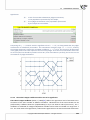
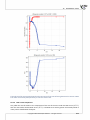
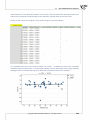
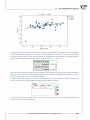
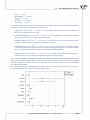
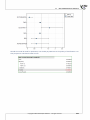
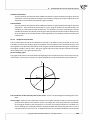
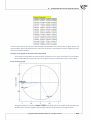
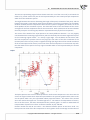
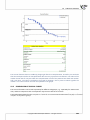
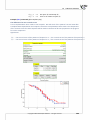
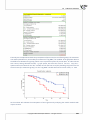
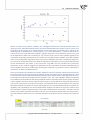
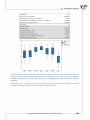
Factor loadings graph
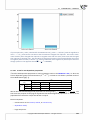
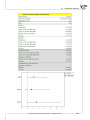
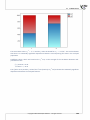
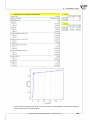
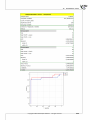
The graph shows the two first principal components which represent 72.96% of the variance and
22.85% of the variance, together amoun ng to 95.81% of the variance of original values
Copyright ©2010-2014 PQStat So ware − All rights reserved
273