1
Roughness Monitor
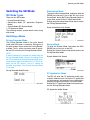
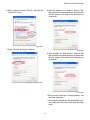
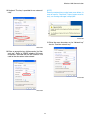
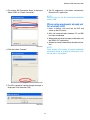
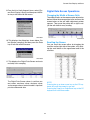
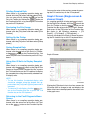
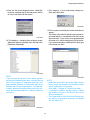
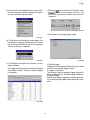
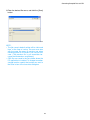
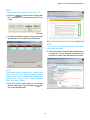
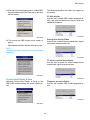
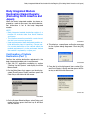
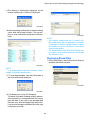
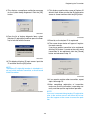
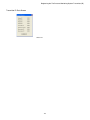
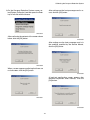
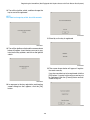
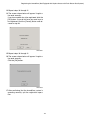
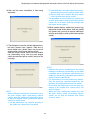
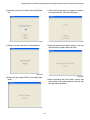
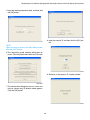
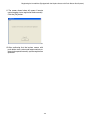
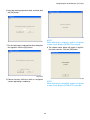
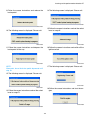
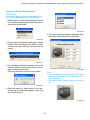
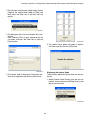
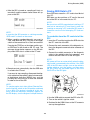
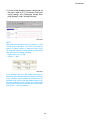
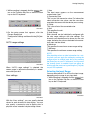
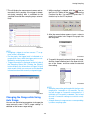
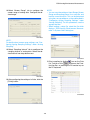
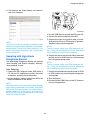
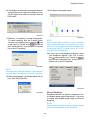
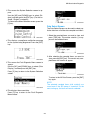
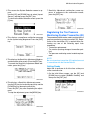
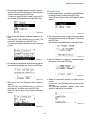
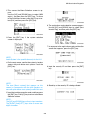
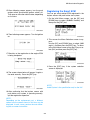
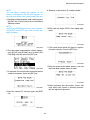
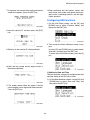
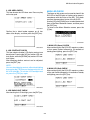
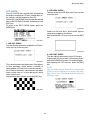
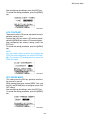
7. This displays the graph screen.
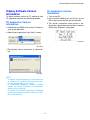
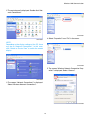
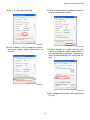
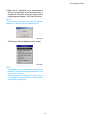
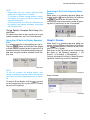
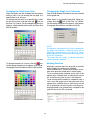
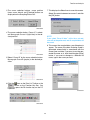
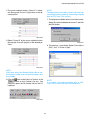
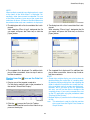
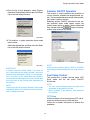
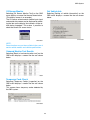
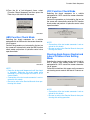
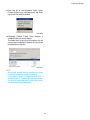
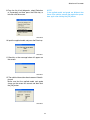
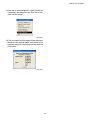
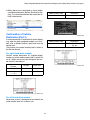
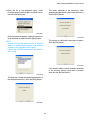
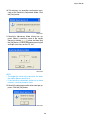
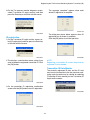
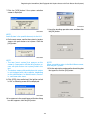
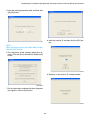
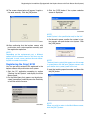
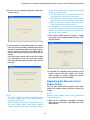
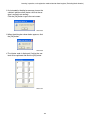
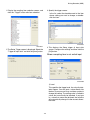
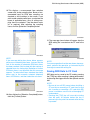
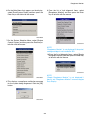
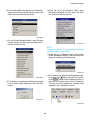
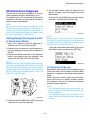
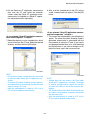
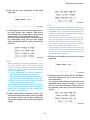
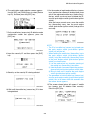
3. Select desired range and then click the [OK] button to apply the setting.
To cancel to change the range, click the [Cancel]
button.
SMU-00792
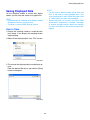
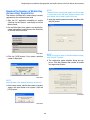
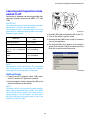
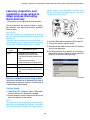
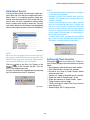
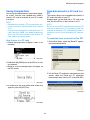
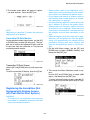
Saving Sampled Data
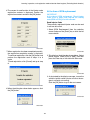
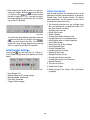
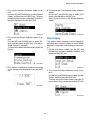
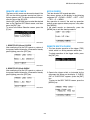
This explains how to save the sampled data with
High-Grade Roughness Monitor.
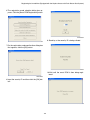
SMU-00782
NOTE:
You can save the data at Simple Roughness Monitor using the same procedures as those described
under “Current Data Display and Save”. See the description.
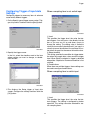
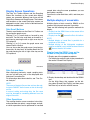
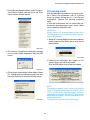
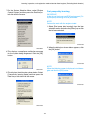
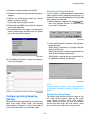
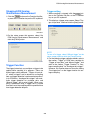
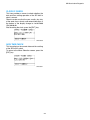
Changing Graph Range
High-Grade Roughness Monitor sets the vertical
axis range of the graph automatically after sampling, however you can configure the range manually.
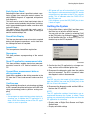
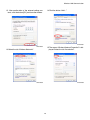
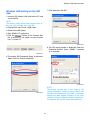
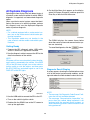
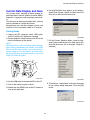
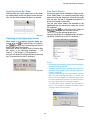
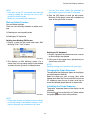
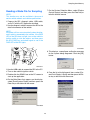
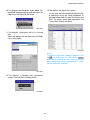
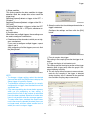
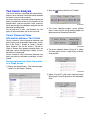
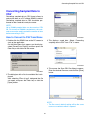
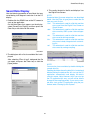
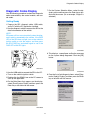
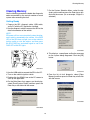
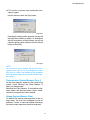
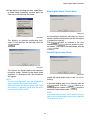
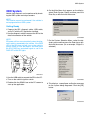
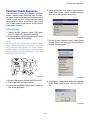
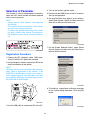
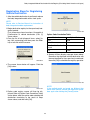
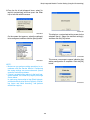
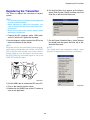
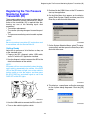
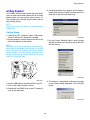
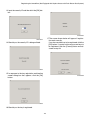
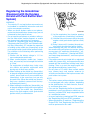
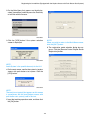
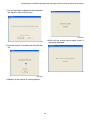
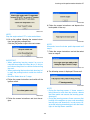
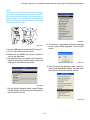
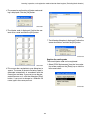
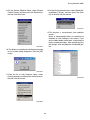
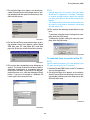
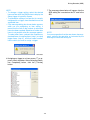
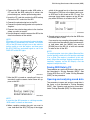
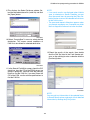
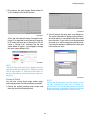
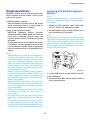
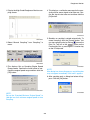
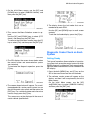
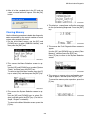
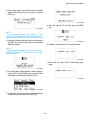
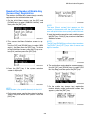
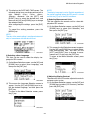
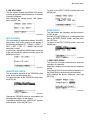
1. Select “Save as” from “File” in menu. You can
also save by clicking
icon on the Data List
Tool bar or the
button on the Function
Key Bar, or pressing the F9 function key on the
PC keyboard.
NOTE:
You can change the range at Simple Roughness
Monitor using the same procedures as those described under “Current Data Display and Save”.
See the description.
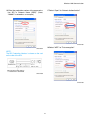
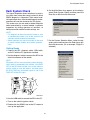
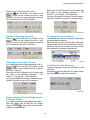
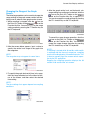
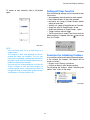
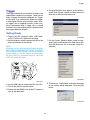
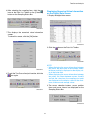
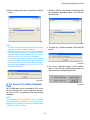
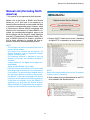
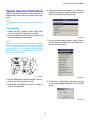
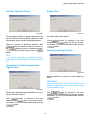
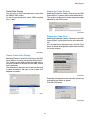
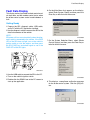
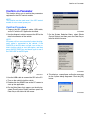
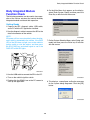
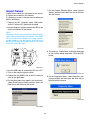
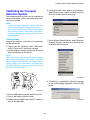
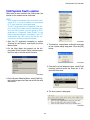
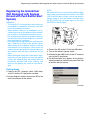
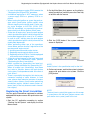
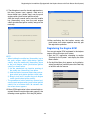
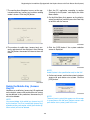
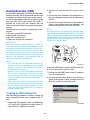
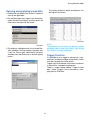
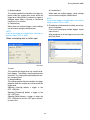
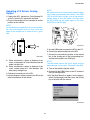
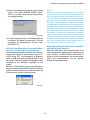
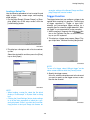
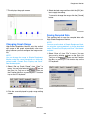
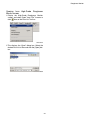
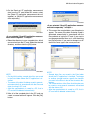
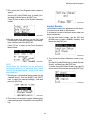
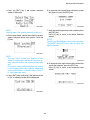
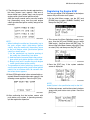
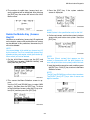
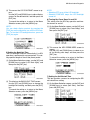
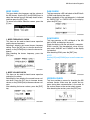
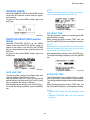
1. Select “Set up Graph Range” from “View” in
menu. You can also select by clicking
icon on
the Data List Tool bar or the
button on
the Function Key Bar, or pressing the F7 function
key on the PC keyboard.
SMU-00790
SMU-00795
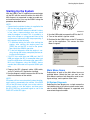
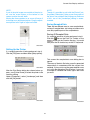
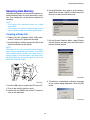
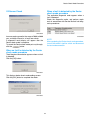
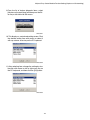
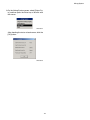
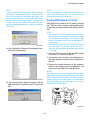
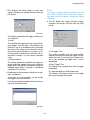
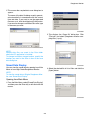
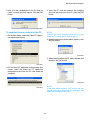
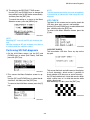
2. Click the arrow displayed in graph range setting
screen.
SMU-00791
209