1
Real-world concerns
- Multipath fade
- High power amplifier
nonlinearities
- Advanced design mode
System Block
Diogrom:
Probe Pointer:
rn
Experimental exercise
- Probability of error [P(e)l vs.
SNR
- P(e) vs. filter bandwidth
- Multipath and “ M curves
- Distortion caused by HPA
nonlinearities
rn
Additional information
- Theory of I-&
modulation/demodulation
- Nyquist filters
- Bandwidth
System Signal
Displays;
Lab Notebook
Pages:
System
Porameters
and Key List
Modulation
Type‘OPSK
Filter Alpha’
SNR. 4068
3
l-qIflIJ.1
L
- FCC
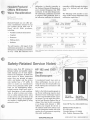
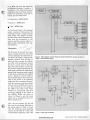
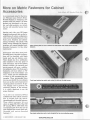
Figure 1. 1-0 Tutor system overview. Using Hewlett-Packard’s 1-0 Tutor is like walking
through a complete digital microwave communications system with a handy set of test
equipment and displays.
explore the effects of degraded signalto-noise ratios, filter coefficient variations, and nonlinearities on system
error rates.
Even if you are only a casual computer user, you will quickly feel comfortable operating the program after
followingthe step-by-step instructions
in the manual. You can easily work
I-& Tutor into your busy schedule.
The entire program takes about eight
hours and can be spread over as
many sessions as you need.
Ordering Information
Subjects Covered Include:
rn
f-l
The HP Model number of I-& Tutor
is HP 11736A and the U.S. list price
is $95.00. You will need an HP 9000
Model 216A or Model 236A computer
with 640K bytes of memory, or the
Model 236C with 896K bytes. For
more information order flyer number
5954-6370 from your local HewlettPackard sales office listed in your
telephone white pages. 0
Understanding fundamental
concepts
- Phase and magnitude
- Practical digital modulation
techniques
- BPSK
- QPSK
- 16QAM
- Offset QPSK
- Offset 16QAM
- Understanding the system
block diagram
/7
Q
Clean and
tight crossover points
indicate errorfree transmission
Q or I
vs. time
eye diagram
/
/
\
Time
Clock Instant
Transition Period
Vector
Diagram
I
~T
*
*
I
*
I
Constellation
Diagram
.
’3
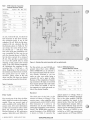
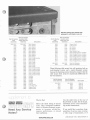
Figure 2. This is a constellation display.
You can examine the effects of system nonlinearities, such as amplitude compression
distortion, on the I and 0 vector diagrams.
2 BENCH BRIEFS JUNE/AUGUST 1985
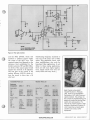
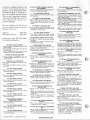
Figure 3. Learn by exploring. You are able to change how the system operates and
immediately view the effects of those changes, such as degraded signal-to noise ratios
causing a closing of the “eye.”
WWW.HPARCHIVE.COM