1
536
Y. Zhang, R. Cheng, and J. Chen
pdf (uniform)
pdf
(Gaussian)
temp.
reported by
sensor
temp.
o
25 C
o
26 C
uncertainty
region
(a)
o
27 C
location
Reported by
sensor
uncertainty
region
(b)
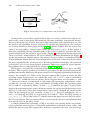
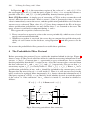
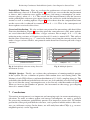
Fig. 1. Uncertainty of (a) temperature and (b) location
An important issue in these applications is data uncertainty, which exists due to various factors, such as inaccurate measurements, discrete samplings, and network latency.
Services that make use of these data must take uncertainty into consideration, or else
the quality and reliability may be affected. To capture data uncertainty, the attribute
uncertainty model has been proposed in [20,23,3], which assumes that the actual data
value is located within a closed region, called the uncertainty region. In this region, a
non-zero probability density function (pdf) of the value is defined, such that the integration of pdf inside the region is equal to one. Figure 1 (a) illustrates that the uncertain
value of a room’s temperature in 1D space follows a uniform distribution. In Figure 1
(b) the uncertainty of a mobile object’s location in 2D space follows a normalized Gaussian distribution. Notice that the actual temperature or location values may deviate from
the ones reported by the sensing devices. Based on attribute uncertainty, the notion of
probabilistic queries has been recently proposed. These are essentially spatial queries
that produce inexact and probabilistic answers [3,4,17,16,14,1].
In this paper, we study the evaluation of the continuous probabilistic query (or CPQ
in short). These queries produce probabilistic guarantees for the answers based on the
attribute uncertainty. Moreover, the query answers are constantly updated upon database
change. An example of a CPQ can be one that requests the system to report the IDs
of rooms whose temperatures are within the range [26o C, 30o C], with a probability
higher than 0.7, within the next two hours. Let us suppose there are two rooms: r1 and
r2 , where two sensors are deployed at each room and report their temperature values
periodically. At time instant t, their probabilities of being within the specified range
are 0.8 and 0.3 respectively. Hence, at time t, {r1 } would be the query answer. Now,
suppose that the temperature values of the two rooms are reported to the querying server
at every tP time units. Since their temperature values can be changed, the answer to the
CPQ can be changed too. For example, at time t + tP , the new probabilities for r1
and r2 of satisfying the CPQ are respectively 0.85 and 0.7. Then, the CPQ answer at
t+tP is {r1 , r2 }. We call the value 0.7, which controls the query answer, the probability
threshold parameter. This parameter allows a user to specify the level of confidence that
he wants to place in the query result.
A simple method for evaluating a CPQ is to allow each sensing device to periodically report their current values, evaluate the probabilities of the new sensor values, and
update the query result. This approach is, however, expensive, because a lot of energy