1
Chapter 20
Digital Filter Design Application
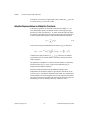
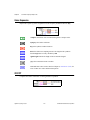
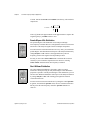
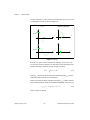
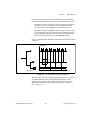
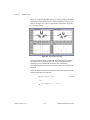
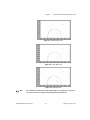
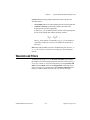
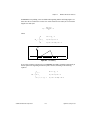
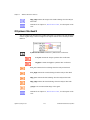
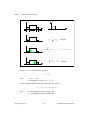
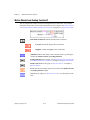
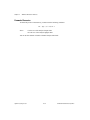
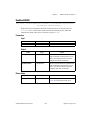
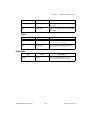
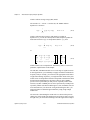
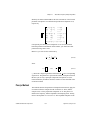
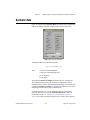
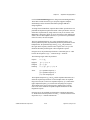
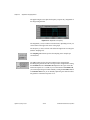
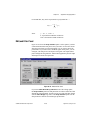
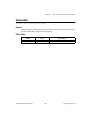
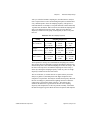
In the passband, the filter gain is guaranteed to be at least as high as
the specified passband response (Gp):
H ( f ) ≥ Gp
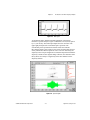
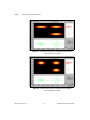
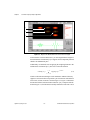
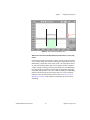
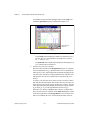
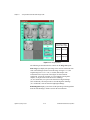
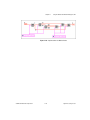
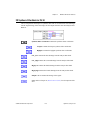
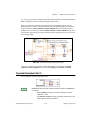
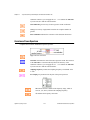
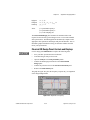
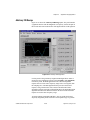
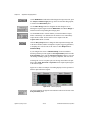
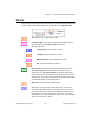
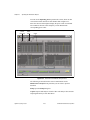
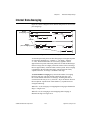
The first passband frequency defines one frequency edge of the passband.
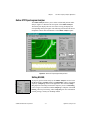
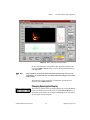
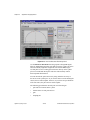
The first vertical blue cursor line represents this frequency in the
Magnitude vs Frequency plot.
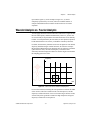
The second passband frequency defines the second frequency edge of
the passband. The second vertical blue cursor line represents this frequency
in the Magnitude vs Frequency plot.
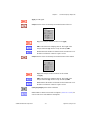
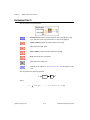
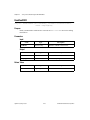
The stopband attenuation is the minimum attenuation in the stopband.
The horizontal red cursor line represents this attenuation in the
Magnitude vs Frequency plot.
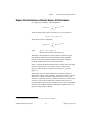
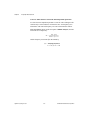
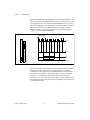
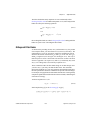
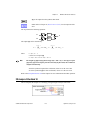
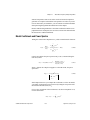
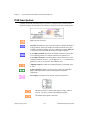
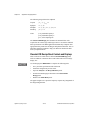
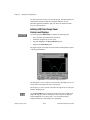
In the stopband, the filter gain is guaranteed to be no higher than the
specified stopband attenuation (Gs):
H ( f ) ≤ Gs
The first stopband frequency defines one frequency edge of the stopband.
The first vertical red cursor line represents this frequency in the
Magnitude vs Frequency plot.
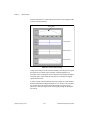
The second stopband frequency defines the second frequency edge of
the stopband. The second vertical red cursor line represents this frequency
in the Magnitude vs Frequency plot.
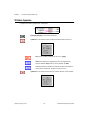
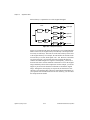
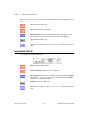
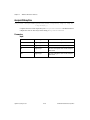
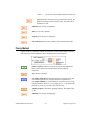
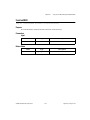
The sampling rate control specifies the sampling rate in samples per
second (hertz).
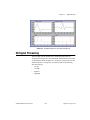
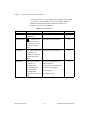
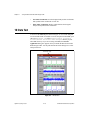
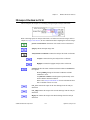
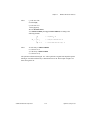
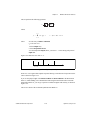
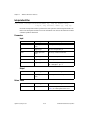
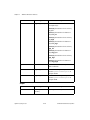
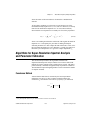
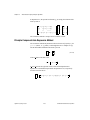
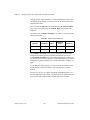
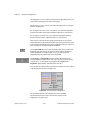
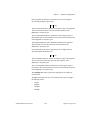
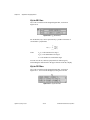
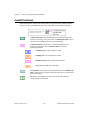
The type control specifies one of four classical filter types according to
the following values:
•
lowpass
•
highpass
•
bandpass
•
bandstop
© National Instruments Corporation
20-13
Signal Processing Toolset