1
DRAFT
Common Connection Features
Working with Hardware Diagnostics Window
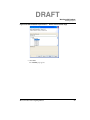
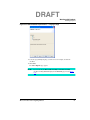
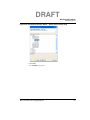
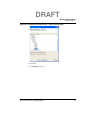
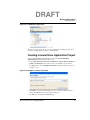
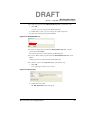
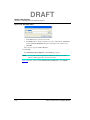
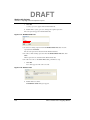
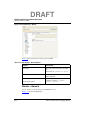
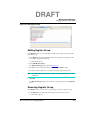
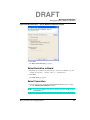
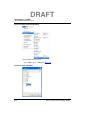
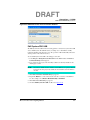
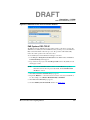
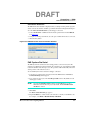
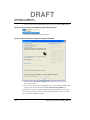
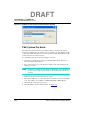
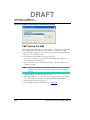
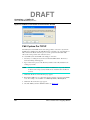
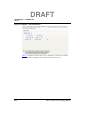
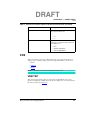
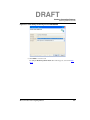
3. Click OK.
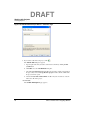
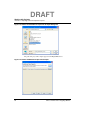
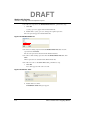
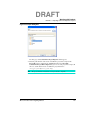
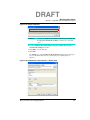
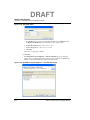
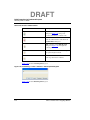
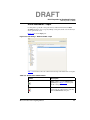
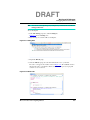
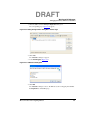
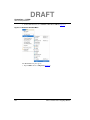
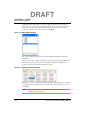
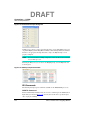
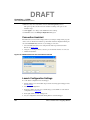
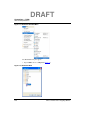
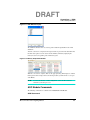
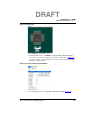
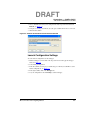
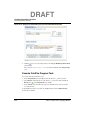
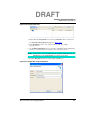
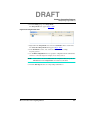
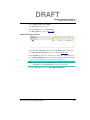
4. Click
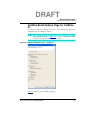
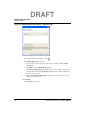
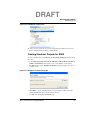
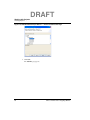
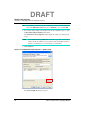
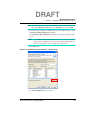
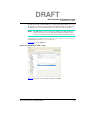
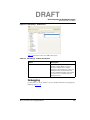
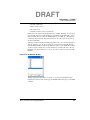
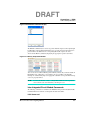
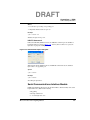
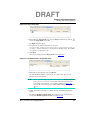
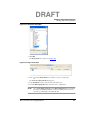
from the Target Tasks view toolbar to create a new target task.
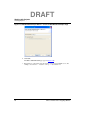
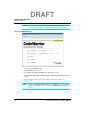
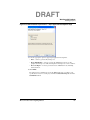
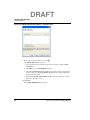
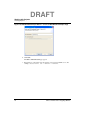
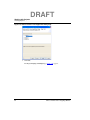
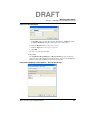
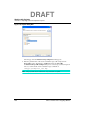
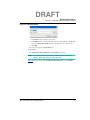
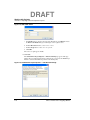
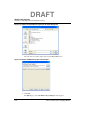
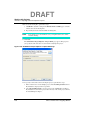
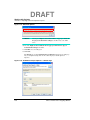
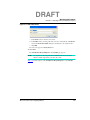
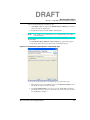
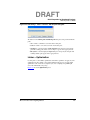
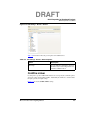
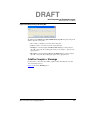
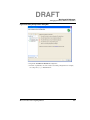
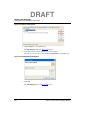
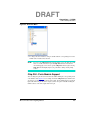
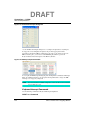
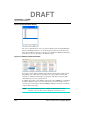
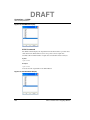
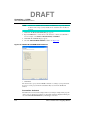
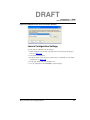
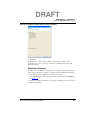
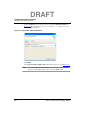
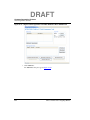
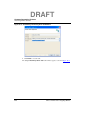
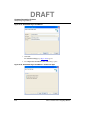
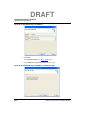
The Create New Target Task wizard appears.
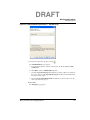
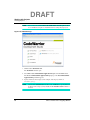
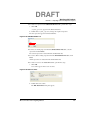
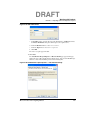
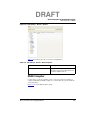
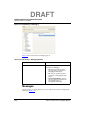
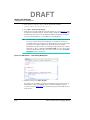
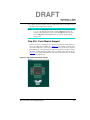
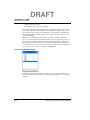
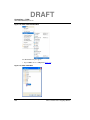
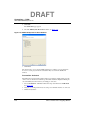
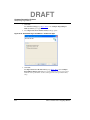
5. In the Task Name text box, enter the name of the target task.
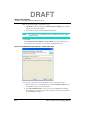
6. From the Run Configuration drop-down list, select a configuration.
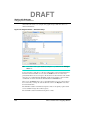
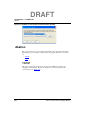
NOTE
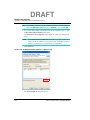
Select Active Debug Context from the Run Configuration drop-down list, if
you want to use hardware diagnostics over an active debugger session, else
select any of the specified debug context from the list.
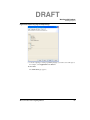
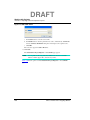
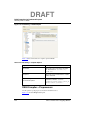
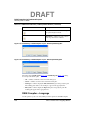
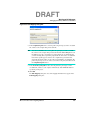
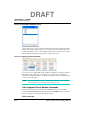
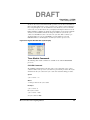
7. From the Task Type drop-down list, select Hardware Diagnostic.
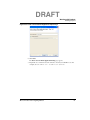
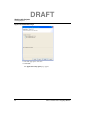
8. Click Finish.
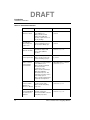
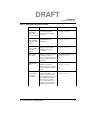
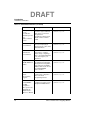
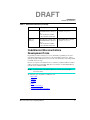
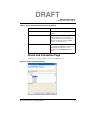
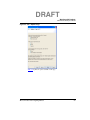
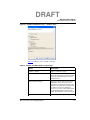
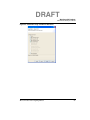
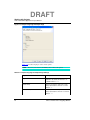
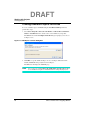
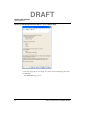
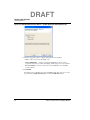
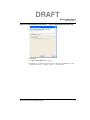
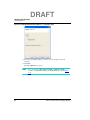
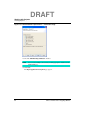
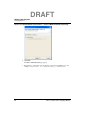
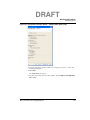
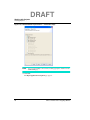
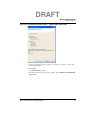
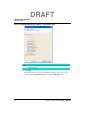
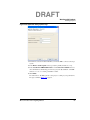
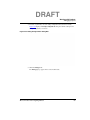
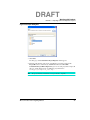
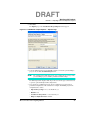
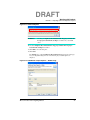
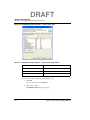
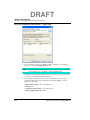
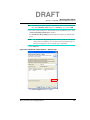
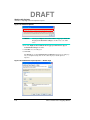
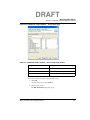
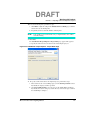
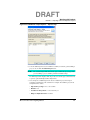
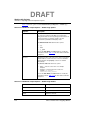
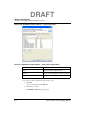
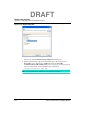
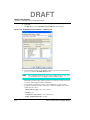
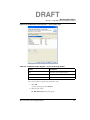
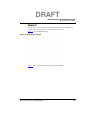
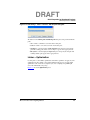
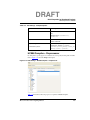
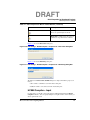
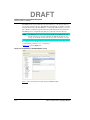
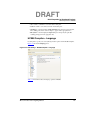
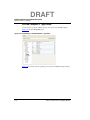
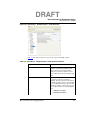
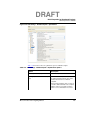
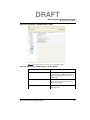
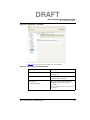
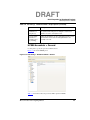
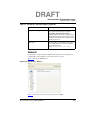
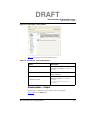
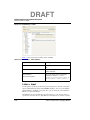
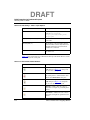
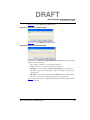
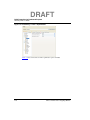
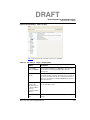
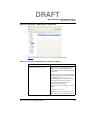
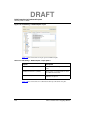
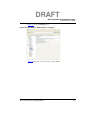
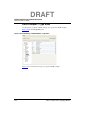
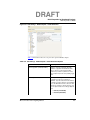
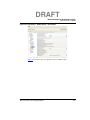
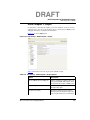
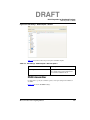
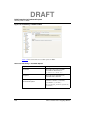
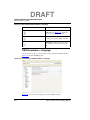
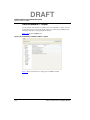
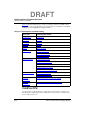
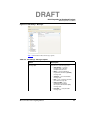
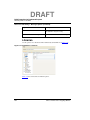
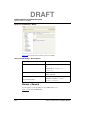
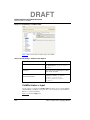
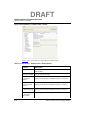
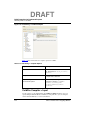
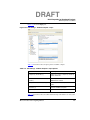
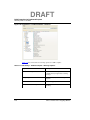
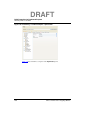
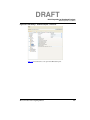
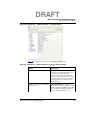
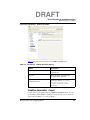
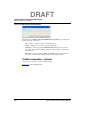
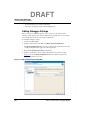
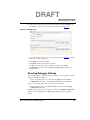
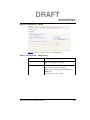
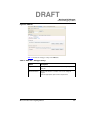
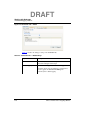
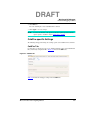
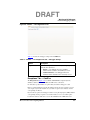
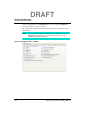
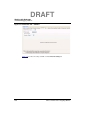
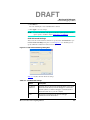
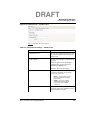
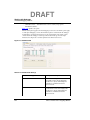
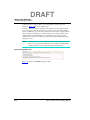
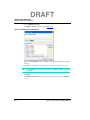
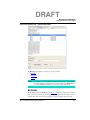
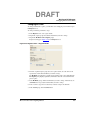
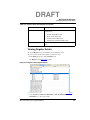
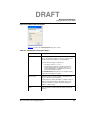
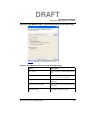
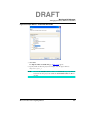
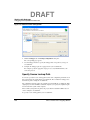
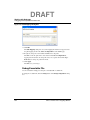
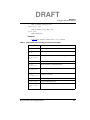
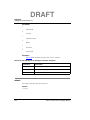
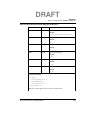
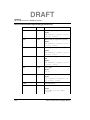
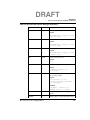
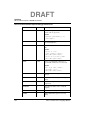
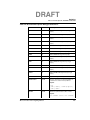
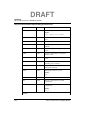
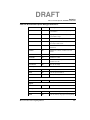
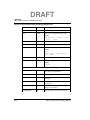
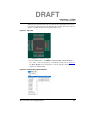
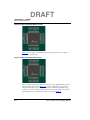
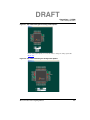
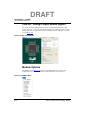
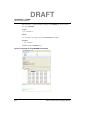
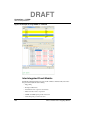
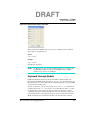
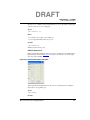
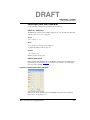
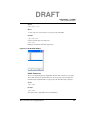
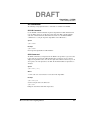
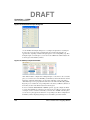
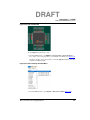
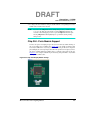
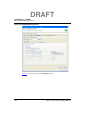
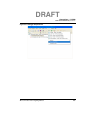
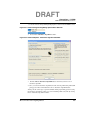
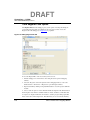
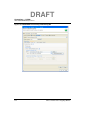
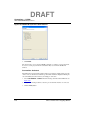
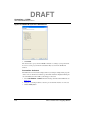
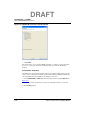
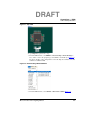
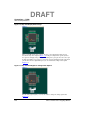
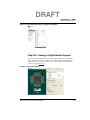
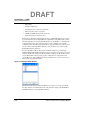
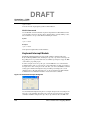
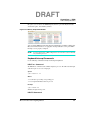
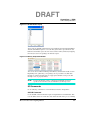
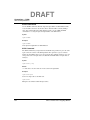
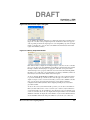
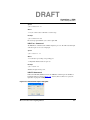
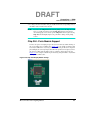
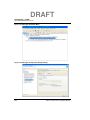
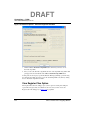
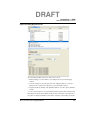
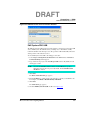
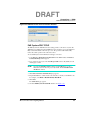
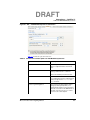
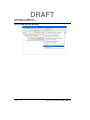
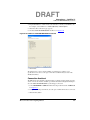
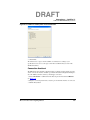
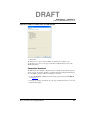
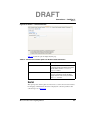
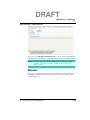
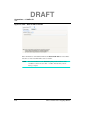
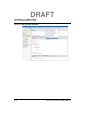
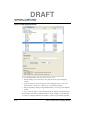
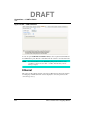
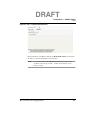
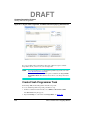
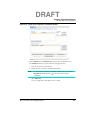
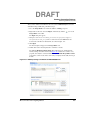
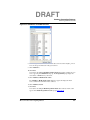
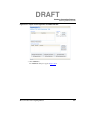
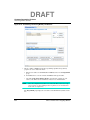
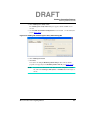
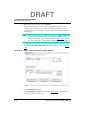
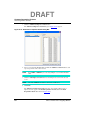
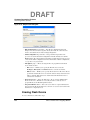
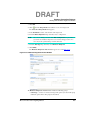
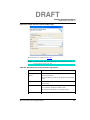
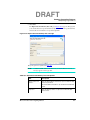
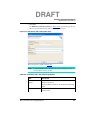
The Hardware Diagnostics Action window appears as seen in Figure 10.39.
Figure 10.39 Hardware Diagnostics Action Window
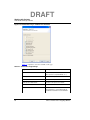
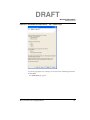
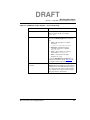
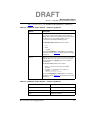
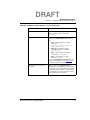
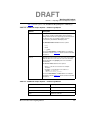
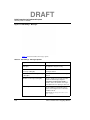
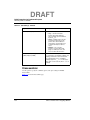
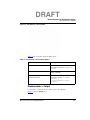
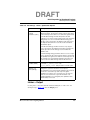
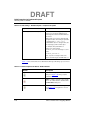
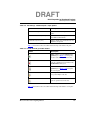
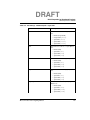
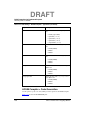
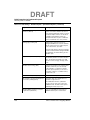
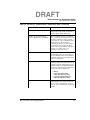
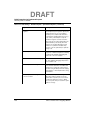
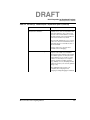
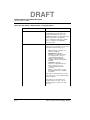
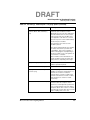
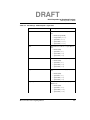
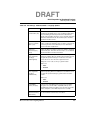
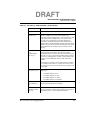
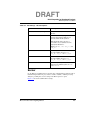
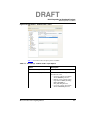
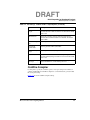
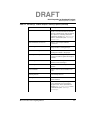
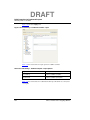
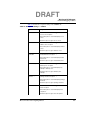
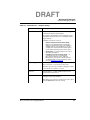
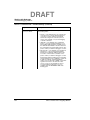
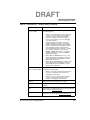
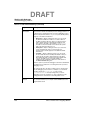
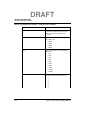
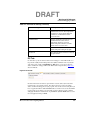
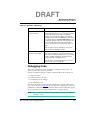
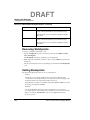
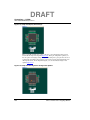
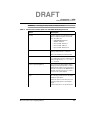
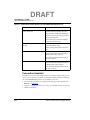
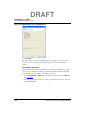
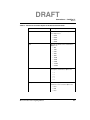
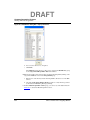
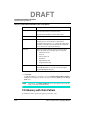
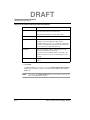
The Hardware Diagnostics Action window includes the following groups:
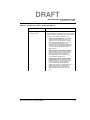
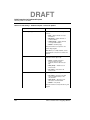
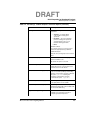
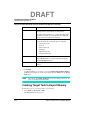
• Action Type — Used to set various action types. The options you select in this group
enables the options in the other groups of the window.
Microcontrollers V10.x Targeting Manual
669