1
4.3.2 Using the data
Starting with the flag, then bombs, marshal, general, spy and then the lower pieces I now
one by one place the pieces on the board according to the probability distribution found
earlier. Whenever a piece is put on the board, the probabilities of adjacent fields are
multiplied with the relative frequency of the ranks being adjacent to the rank that was just
put on the board.
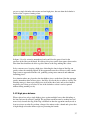
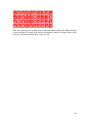
Flag distribution
General distribution
Bomb distribution
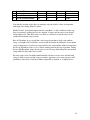
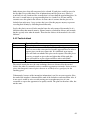
Legend
Colonel distribution
0%
1%
2%
3%
4-5%
6-8%
8%+
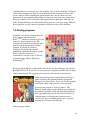
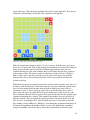
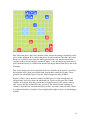
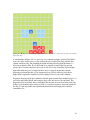
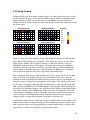
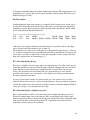
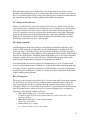
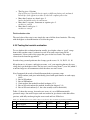
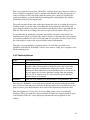
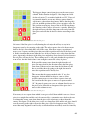
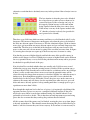
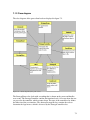
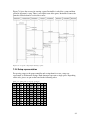
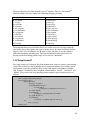
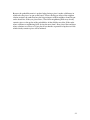
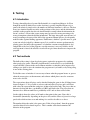
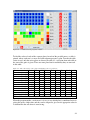
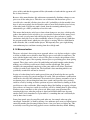
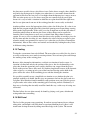
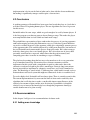
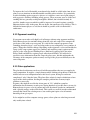
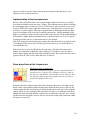
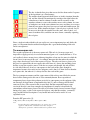
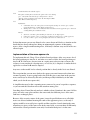
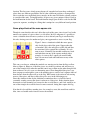
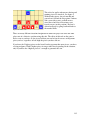
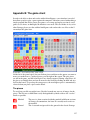
Figure 4.1 – The probability distribution of a selection of ranks.
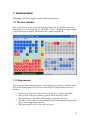
Figure 4.1 shows the some examples of these probability distributions. It shows that the
flag is nearly always on the last row. In 66% of the setups, the flag was on any of the 8
purple squares. Bombs can be expected anywhere on the field, but with a very low
probability on the front 2 rows. The squares next to the back corners have the highest
probability. Possibly to protect a corner flag, or to fake a flag position by bombing in a
sergeant (both are common strategies). Not surprisingly, the higher pieces are usually
more to the front while the lower pieces appear more often in the back.
These statistics assume however that the position of a piece doesn’t depend on the other
pieces at all. This is assumption would be very hard to defend. In practice, there are
probably all kind of relations between the positions of pieces and in a well thought over
setup the position of each piece may depend on all the others. To model this, one would
need to store a relation for each field with each other field for each rank with each other
rank, resulting in 40x40x12x12= 230.400 numbers. Even though it would in principle be
possible to store that many numbers, they would have little statistical significance if they
were collected from a mere 20.000 setups. I therefore chose to simplify the model and
assume that the probabilities are only dependent on the pieces directly next to them. It
seemed obvious to discriminate between the different directions because a flag for
example would very often appear behind a bomb but rarely before one.
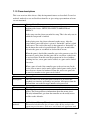
I counted the number of times a rank appears next to another rank and divided this by the
number of times this was expected to happen. This calculation results in a number larger
than 1 for pieces that are often put together and a number smaller than 1 for pieces that
appear next to each other less than the average number of times.
43