1
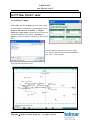
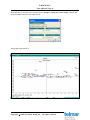
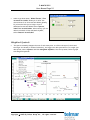
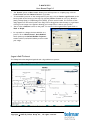
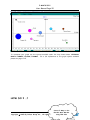
P-MAPS 2011 User Manual Page 3 INTRODUCTION Telmar’s innovative P-Maps program allows clients to plot full-colour graphs directly from TNT+ or using their own data (please see page 18 of the manual). To create a map directly from TNT+ all the user has to do is enter two columns in TNT+ (e.g. ‘Age 45+’; ‘Class ABC1’) together with a selection of rows (usually brands). In a matter of seconds P-Maps will plot your TNT+ data as a full colour graph, with your two columns represented by the X and Y axes. Main Features Of Telmar P-Maps A quick and easy way to obtain an instant overview of a market. Graphs are plotted directly from TNT+. Full-colour graphs. Brand sizes can be represented by different sized circles. Ability to customise the appearance of your P-Map. Option of exporting your P-Map into PowerPoint or a similar graphics package. For further assistance call the Helpdesk on 020 7467 2575 Copyright 2015 By Telmar Group Inc., All rights reserved