1
User’s Manual
6.1.3.
261
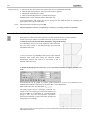
Diagram display
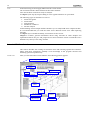
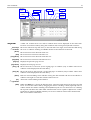
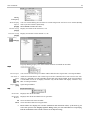
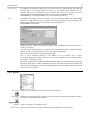
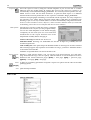
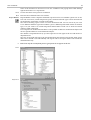
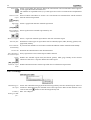
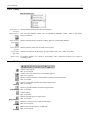
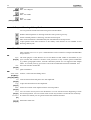
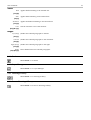
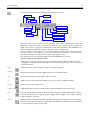
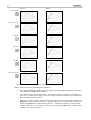
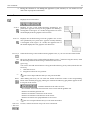
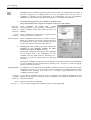
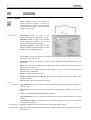
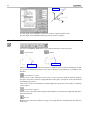
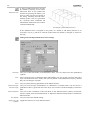
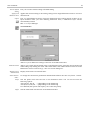
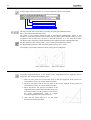
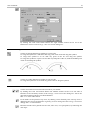
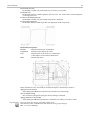
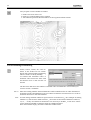
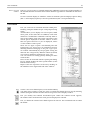
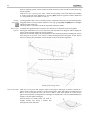
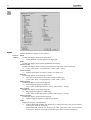
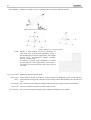
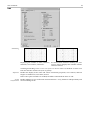
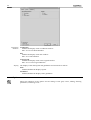
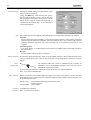
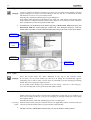
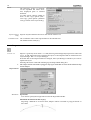
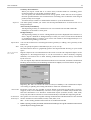
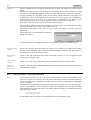
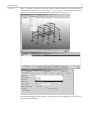
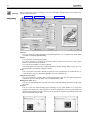
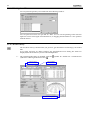
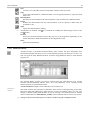
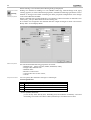
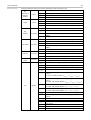
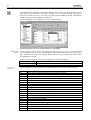
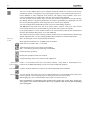
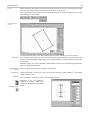
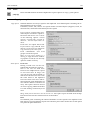
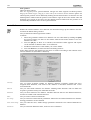
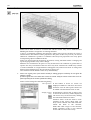
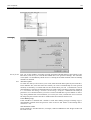
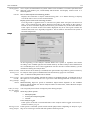
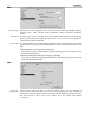
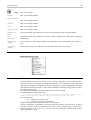
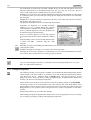
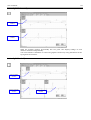
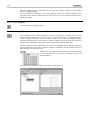
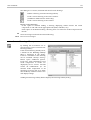
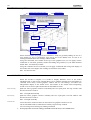
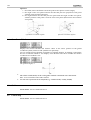
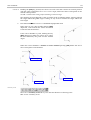
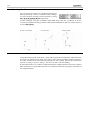
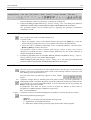
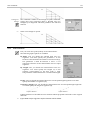
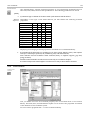
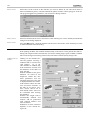
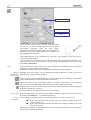
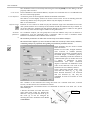
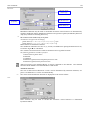
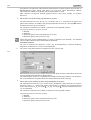
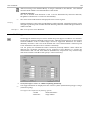
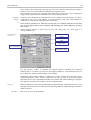
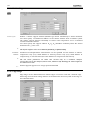
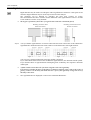
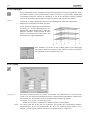
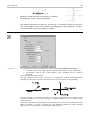
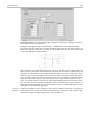
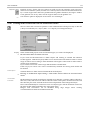
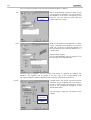
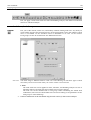
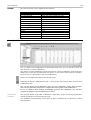
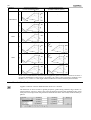
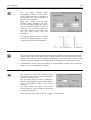
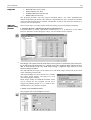
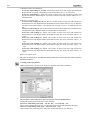
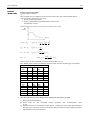
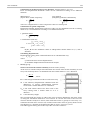
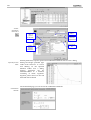
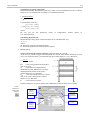
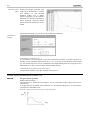
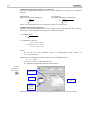
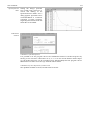
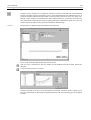
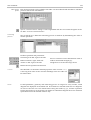
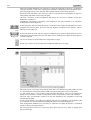
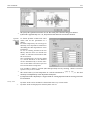
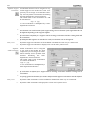
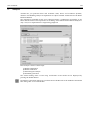
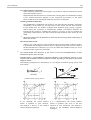
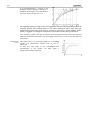
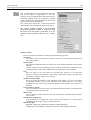
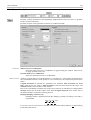
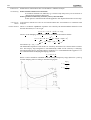
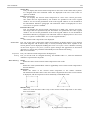
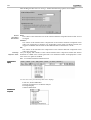
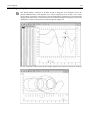
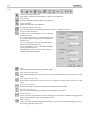
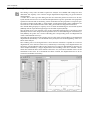
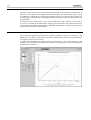
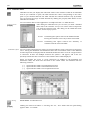
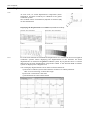
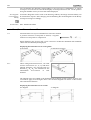
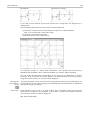
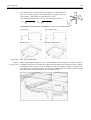
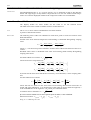
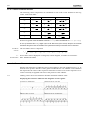
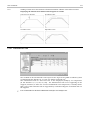
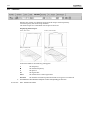
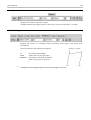
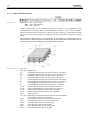
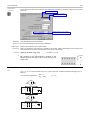
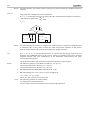
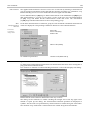
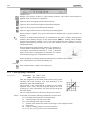
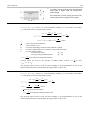
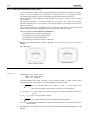
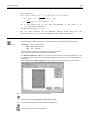
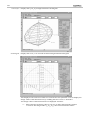
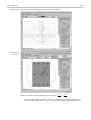
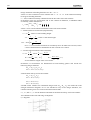
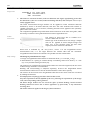
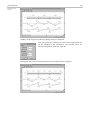
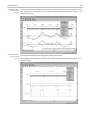
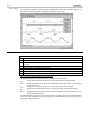
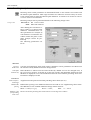
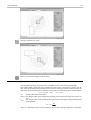
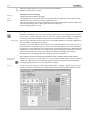
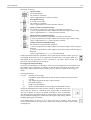
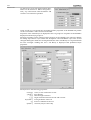
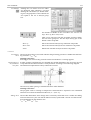
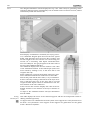
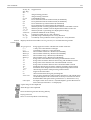
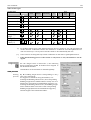
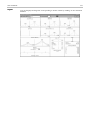
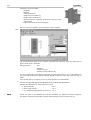
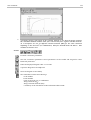
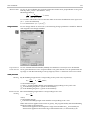
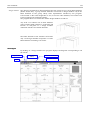
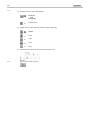
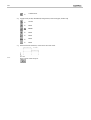
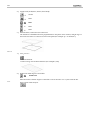
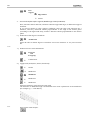
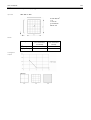
This dialog displays nonlinear or dynamic results as diagrams. Two diagrams can be displayed simultaneously. Each diagram has a result component on its X and Y axis. Points
representing consecutive value pairs are connected. Reading coordinates can be changed by
dragging the dashed lines or the black mark of the bottom trackbar. Diagram points can be
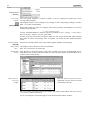
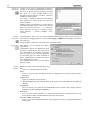
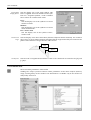
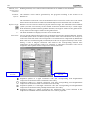
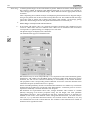
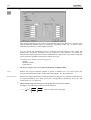
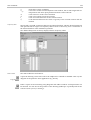
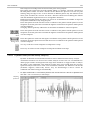
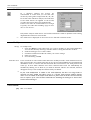
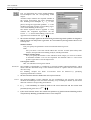
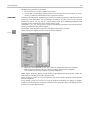
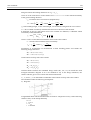
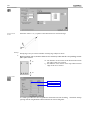
displayed as a table and exported to Excel through the Clipboard.
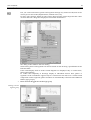
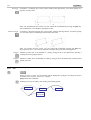
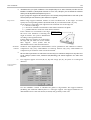
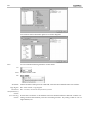
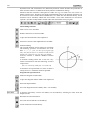
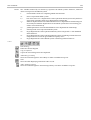
In case of dynamic analysis the bottom trackbar displays time instead of increment numbers.