1
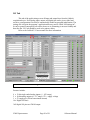
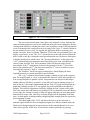
The operators themselves are selectable via drop-down boxes, and 4 choices are
given: add, subtract, multiply, and divide. When the “Calculate Result” button is pressed,
the operations are carried out on the 4 plots and a “Result” plot is created and graphed on
the tab which called the function. When a data operation is in progress the status indicator
will display “Calculating result” to let the user know the operation is in progress.
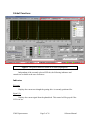
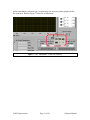
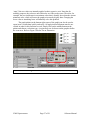
Figure 19 above shows the data manipulation window and the selected function:
Plot 1 is to be added to Plot 2. The First two plots in the equation are meaningless since
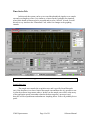
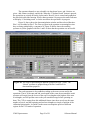
they are being multiplied by a constant of 0. Figure 20 below shows the resulting
spectrum in yellow graphed with Plot 1 and 2 to show that the operation was successful.
Figure 20: The result of performing an addition operation of Plot1 + Plot2. The
“Result” spectrum is graphed along with Plot 1 and Plot2 for
demonstration purposes.
The result spectrum is also padded according to the source scans used in the
operations. That is, if the start and end wavelengths of the scans do not match the result
spectrum will range from the lowest of the scan wavelengths to the highest of the scan
wavelengths, and will pad the scans so they all match this range before operating on
them. The CCD is exempt from this additional feature since there are always the same
number of pixels, and the beginning and end wavelengths are simply a function of the
calibration polynomials. It wouldn’t make sense to manipulate spectra of different
regions for the CCD mode of operation.
VM92 Spectrometer
Page 29 of 36
Software Manual