1
10. THE MODEL SUMMARY WORKSHEET: An innovative feature of RegressIt is that it maintains
a separate “Model Summary” worksheet that shows side-by-side summary statistics and model
coefficients for all regression models that have been fitted in the same workbook. This allows easy
comparison of models, and it also provides an audit trail for all of the models you have fitted so far.
Models that used a different dependent variable are arranged side-by-side farther down on the sheet.
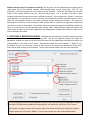
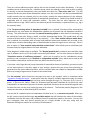
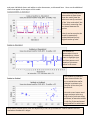
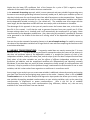
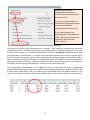
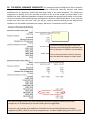
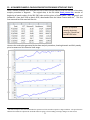
Here’s an example of the model summary worksheet for the three models fitted above. If you move the
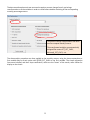
mouse over one of the “run time” cells, you will get a pop-up window showing you the elapsed time
needed to run the model and produce the output, which was 2 seconds for the first model:
The model summary worksheet shows the
summary stats and coefficient estimates and
their P-values for all models in the workbook.
The run times can also be seen by mousing
over the date/time stamps as shown above.
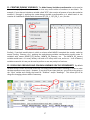
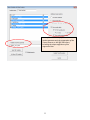
The stats of models fitted to the same dependent variable are displayed side-by-side for easy
comparison, as illustrated here for the two models fitted to logged data.
In this case, the inclusion of the additional 3 variables in the last model affected the estimated
coefficient of PRICE_18PK_LN, but not by a huge amount. Its value changed (only) from -0.67 to -0.59.
26