1
User’s Manual for VERDI 1.5
To go back to the default method for determining breaks between bins, enter -legendBins
DEFAULT.
[-level <level>] sets the level range of all formulas to the single level specified.
[-levelRange <levelMax> <levelMin>] sets the level range of all formulas to the range
specified.
[-openProject <VERDIProjectName>] opens a previously save VERDI project.
[-mapName <pathname>/<mapFileName> causes VERDI to use the supplied map name instead
of the default map for tile plots.
[-printAlias] prints existing alias definitions.
[-project “<VERDIProjectName>”] save dataset lists and associated formulas as a
“project” for later re-use.
[-QuickTime (NEW)] creates a QuickTime movie of the currently selected plot.
[-quit|exit] ends the VERDI session.
[-raiseWindow <windowid>] raises the window with the specified plot ID (i.e., brings it to
the front).
[-s "<formula>"] loads the specified formula into VERDI’s memory, and makes it the
currently selected formula.
[-save2ascii "<filename>"] export data to a tab-delimited data file suitable for reading
into a spreadsheet application such as Excel.
[-saveImage "<image type>" <file name>] saves the most recently created plot. This
command works for all plot types. Supported formats include PNG, BMP, TIF, and JPG.
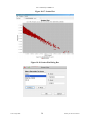
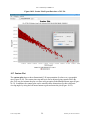
[-scatter "<formula1>" "<formula2>"] creates a scatter plot using the two formulas
specified. Note that the formulas for the two components should already have been loaded
into VERDI, and they are case sensitive.
[-showWindow <windowId> <timestep>] sets the time step of the window with the
specified window ID to the specified time step. The time step must be within the allowable
range for the dataset.
[-subDomain <xmin> <ymin> <xmax> <ymax>] sets the VERDI domain matching the
currently selected dataset to the bounding box specified by its arguments. The currently
selected dataset is the most recently added dataset. It is often handy to type -subdomain
commands into VERDI’s standard input if you are trying to select a very precise subdomain
(such as that needed for a vertical cross-section plot).
[-subTitle1 "<sub title 1 string>"] allow you to control a plot’s subtitles if desired.
Subsequent plots will use the default subtitles, unless these arguments are used again.
[-subTitle2"<sub title 2 string>"] allow you to control a plot’s subtitles if desired.
Subsequent plots will use the default subtitles, unless these arguments are used again.
UNC–Chapel Hill
115
Institute for the Environment