1
Data Sheet
Interference Troubleshooting
has Never Been so Easy
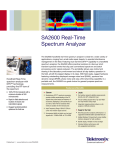
The H600 and SA2600 Series will quickly scan the RF environment,
classify the known signals, and help you locate the unknown signals
with their field-proven signal hunting tools. Featuring real-time DPX™
Live RF spectrum display technology, the H600 and SA2600 Series
offer practical solutions for discovering transient events that slip past
conventional spectrum analyzers. With field-ready, rugged hardware
featuring outstanding displayed average noise level (DANL), spurious free
dynamic range (SFDR), phase noise, and easy LAN networking capability
in a handheld unit, the H600 and SA2600 Series are a great choice for
general-purpose spectrum measurements and ideal signal-hunting tools.
Evolving digital RF communication standards pose an unprecedented
challenge to the surveillance and security community. Identification of
unknown signals and determining their precise location has traditionally
been accomplished using a combination of lab-grade spectrum analyzers,
handheld spectrum analyzers, oscilloscopes, and offline analysis
capabilities using PCs. When lab equipment is used in the field, several
limitations appear. Such instruments are not meant for field use, can
be easily damaged, are not portable, and require AC power. Signal
classification using these systems often requires a lot of prior knowledge
about these signals, particularly when they are digital. With such systems
the unknown signals can be difficult or impossible to identify.
Scan
By scanning the RF spectrum users can spot which signal emitters
are in the area. Signals with significant power are usually candidates
for further analysis, as are signals that are present infrequently. By
color-coding events based on the rate of occurrence, the DPX™ Live RF
spectrum display provides unparalleled insight into the behavior of signals.
Performing 10,000 spectrum updates per second, transients as brief as
2
www.tektronix.com/products/rsa
DPX Spectrum Mask captures and logs spectrum violations with options of warning alarm,
pausing test, export screen, and result save
125 μs can be “frozen” in the frequency domain. This offers tremendous
improvement over swept analysis techniques.
Signals that are present in the spectrum today but were not there yesterday
are of particular interest. Reference signals can be stored and deviations
from this reference can be quickly identified using the trace math feature.
The H600 and SA2600 Series make analysis easier by quickly logging
signals that are weak, bursting, hopping, time multiplexed, or intentionally
random. It takes advantage of the FFT-based spectrum analysis capability
to allow users to see the true shape of the signal, even when it is bursting.
Masks can be automatically created from traces captured earlier. You can
compare this mask to the current trace and if a mask violation occurs, the
trace is logged. Finally, when the spectrogram is paused, you can scroll
through the spectrogram’s time axis and view the results.