1
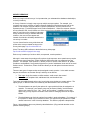
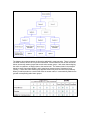
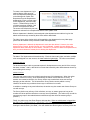
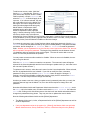
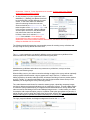
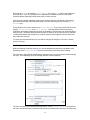
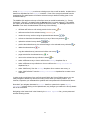
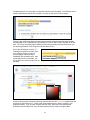
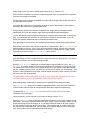
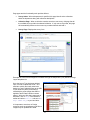
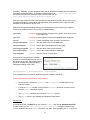
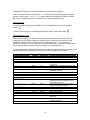
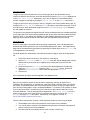
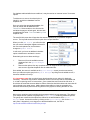
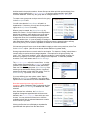
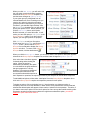
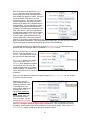
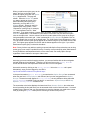
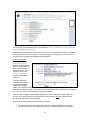
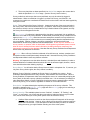
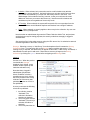
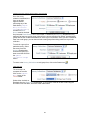
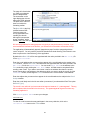
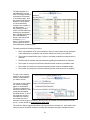
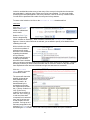
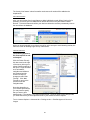
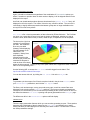
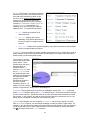
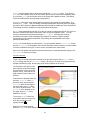
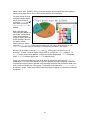
o Paging options allow you to choose between a single page layout or a multipage layout which inserts page breaks between sections. (new) o Assign multiple response types to a single question. E.g., The question, “What is the city and state in which you reside” may have two fields – one text field for the user to enter the city name and one dropdown list to select the state. o Progress Indicators: Multi-page surveys may display progress bars (where each bar represents a page) to indicate to the survey-taker how far along in the process they are currently at. Width and bar colors are customizable. (new) o Answer Matrices: Create Answer Matrices for groups of questions. o Comment Boxes: Allow users to enter optional comments for questions with other response types. E.g., The question, “Do you enjoy working at ABC Bank? (If you answer “no,” please explain.)” will have a “yes/no” radiobutton list as well as a comments field. o Field Validation: Specify which response fields are required fields. o Specify input control types for each response type, including single response controls (e.g., dropdownlists) or multiple response controls (e.g., checkboxes). • Textboxes Radiobuttons Dropdown lists Checkboxes (new) Calendar controls – two to choose from (new) E-mail control (validates input) o Specify your own custom JavaScript for response controls. o Use data from external sources (i.e., another database on the server) to populate dropdownlists with answer options. Data Analysis: o Filter report results by date and, optionally, by question responses (i.e., determine custom filters to use as criteria for generating reports). o Multiple report views (to display comments, raw scores, question averages, section averages, text answers, or any combination of the above). o View reports averaging results collectively or view reports on individual survey submissions one by one. o Detailed Reports produce a visual representation of response value averages (by question and by section). o Pie Chart view allows you to customize the display (new): Rotate Pie charts Resize the graphics Show or hide the legend Show or hide slice labels and percentages Displace a slice for emphasis Display by section, question or the entire survey. 2