1
HMC6383 Evaluation Kit User Manual
Rev. A - v00.0711
•
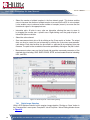
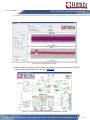
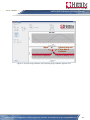
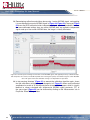
Select the number of plotted samples in the time domain graph. This feature enables
users to increase the number of plotted samples to ensure that the ADC is not saturated,
it also enables users to observe smaller number of samples (zoom in) to ensure that the
time domain signal is the appropriate one.
•
Interactive plots. All plots in easy suite are interactive allowing the users to zoom in
by dragging the mouse over a specific area. Right-clicking over the graph displays all
interactive options available.
•
Select the active channel
•
Save measurement data into a file by clicking on the ‘Save results as’ button. The output
data can also be saved for post processing by clicking the ‘Auto-store measurements’
radio button. Each data iteration can be stored in a separate file by selecting ‘Auto-step
filename. The path for the saved data file can be specified by clicking on ‘Set path’ button.
•
Measurement values menu on the left hand side provides measured parameters of the
received signal including: SNR, SNDR, ENOB, SFDR, and estimated distortion including:
HD2, and HD3.
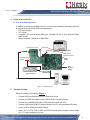
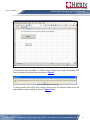
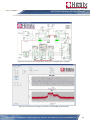
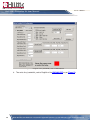
Figure 14. Hittite EasySuite - Wave Plotting Dialog
7.4.1 Digital Image Rejection
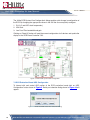
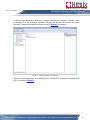
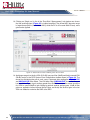
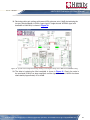
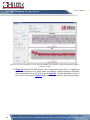
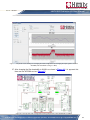
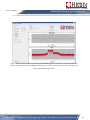
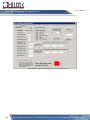
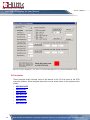
Hittite’s DCR platform features built-in receiver image rejection. Clicking on ‘Open’ button in
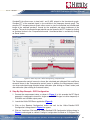
the ‘Compensation’ menu opens ‘ComplexFft’ tab of EasyView - Wave Plotting window shown
in Figure 15.
14
Order On-Line: www.hittite.com. For technical application questions: Tel: 978-250-3343 or apps-support@hittite.com