1
9.15.3
The trending window
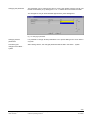
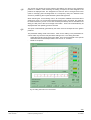
The trending window consists of a data window that is used for the graphic display of
the values over time:
X-axis:
Y-axis:
Time axis
Indication of value; the associated unit depends on the channel settings;
the associated legend is to the right of the data window. The name of a
channel appears when the mouse pointer is moved to the indicated value.
Fig. 32: The trending window
When calling up the trending function , the current status of the selected channels will
immediately appear, but there is no storage in the database yet. That takes place only
after starting a recording, either by clicking «Start», or in the case of a trigger condition,
if activated. Recording is terminated either by clicking «STOP» or in the case of a trigger condition.
9.15.4
Display of a channel
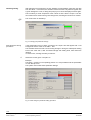
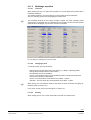
A channel can be activated or deactivated with the associated check box. The color can
after clicking the relevant
be selected with a dialog, which appears in the legend
button.
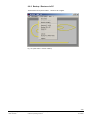
To make the display clearer (making better use of the y-axis), a multiplier / divisor for
the individual channels can be specified. This has an impact on the division ratio of the
input variable and the displayed variable on the graph.
Example:
The temperature value of 500 °C will be displayed as 50 °C when making the following
settings:
• Multiplier = 1
• Divisor = 10
50/64
Building Technologies
HVAC Products
PC Software for Burner Management System LMV5...
9 General operating functions
CC1J7550en
15.08.2006