1
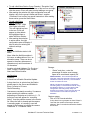
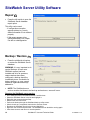
• This tool bar can be undocked, docked or closed.
• The two buttons on the left below this tool bar are for selecting the trees to view the list of system
“Operators” and capture “Stations” that are being monitored.
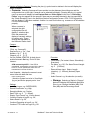
• Example: “Cameras” will display the
list of cameras connected to the
capture station and their particulars
(NOTE: if a Camera’s “video state
is unknown” a red X error indicating
trouble with the camera, will turn
grey). “Storage” will open an
information sheet for the station’s
Drive in use. Displaying available
capacity space, the drive’s total size
and the amount of the drive that has
been used up for captures.
• Settings made in the work area to the right of the tree box affect the items in the trees. The splitter
between the 2 areas can be used to enlarge or reduce the size of both areas. There is a splitter at the
bottom of both these areas also used for resizing.
V1.12
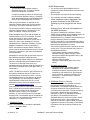
Red/White X in Sample Image:
This indicates the image is invalid
(such as if not being recorded).
Warning Next To Drive Letter:
This indicates a partition being
reported as less than 20GB (which
may indicate drive failure).
• Below these two areas is another bar with various selection buttons on it.
“UnSorted” – You can sort the event list by clicking on some of the column headings. Clicking
"Unsorted" resets the list to show newest events at the top.
“Display:” – These coloured buttons set the types of events to appear in the list:
− “White X in a red circle” – Error events displayed.
− “Explanation mark in a yellow triangle” – Warnings
− “Lower case letter “i” in a call out balloon – Information displayed
− “White X in a gray circle – events from “undefined” conditions. Selections not properly configured.
− The square button on the very right that looks like “a PC hard drive that has stopped working”
represents HDD S.M.A.R.T. NetVision Station hard drive errors. It is depressed by default.
− “Refresh Events” – This button is pressed when an item in the main tree is highlighted and all the events
for that specific item in the Events area are displayed. Maximum 500 events per item.
21-0402E v1.1.3
SiteWatch™ User and Technical Guide
3