1
Force Imaging
Force Calibration Mode
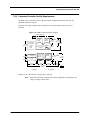
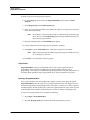
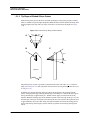
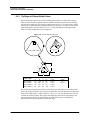
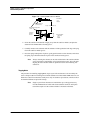
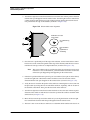
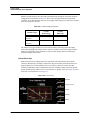
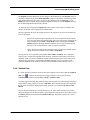
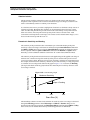
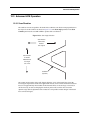
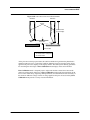
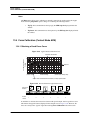
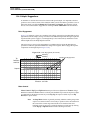
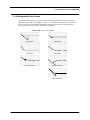
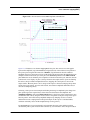
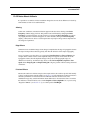
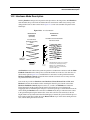
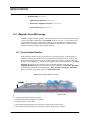
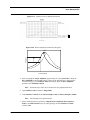
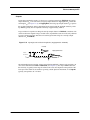
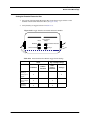
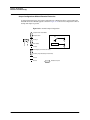
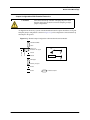
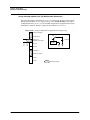
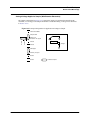
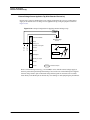
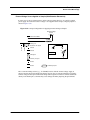
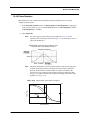
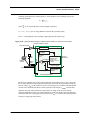
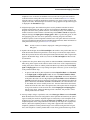
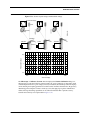
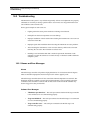
Figure 13.2d Anatomy of a Force Curve
3
1
Piezo retraction
4
2
Down
Cantilever deflection
Up
Piezo extension
6
1
7
5
Piezo extends; tip descends.
No contact with surface yet.
Attractive forces near surface
pull tip down.
2
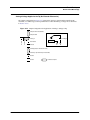
As tip presses into the surface,
cantilever bends upward.
3
4
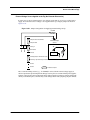
Piezo retracts; tip ascends until forces are in
equilibrium with surface forces.
Cantilever relaxes downward.
Piezo continues retraction; tip ascends further.
Cantilever bends downward as surface
attraction holds onto the tip.
5
As tip continues its ascent, tip finally
breaks free of surface attraction. Cantilever
rebounds sharply upward.
6
7
As piezo continues retracting, tip continues
its ascent. No further contact with surface
this cycle.
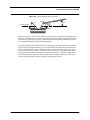
The horizontal axis plots the tip movement relative to the sample. By extending the Z-axis piezo
crystal, the tip descends toward the sample and the tip-sample distance decreases. The descent plots
from right-to-left in yellow on the NanoScope display monitor. By retracting the Z-axis piezo
crystal, the tip ascends away from the sample and the tip-sample distance increases. The ascent
plots from left-to-right in white on the NanoScope display monitor.
Cantilever deflection plots on the vertical axis of the graph. When the cantilever deflects downward,
it plots on the graph’s downward vertical; when the cantilever deflects upward, it plots on the
graph’s upward vertical.
210
Dimension 3100 Manual
Rev. D