1
TPA6011A4
SLOS392 – FEBRUARY 2002
APPLICATION INFORMATION
bridged-tied load versus single-ended lode (continued)
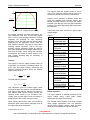
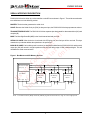
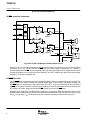
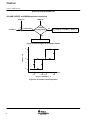
For example, a 68-µF capacitor with an 8-Ω speaker would attenuate low frequencies below 293 Hz. The BTL
configuration cancels the dc offsets, which eliminates the need for the blocking capacitors. Low-frequency
performance is then limited only by the input network and speaker response. Cost and PCB space are also
minimized by eliminating the bulky coupling capacitor.
VDD
–3 dB
VO(PP)
C(C)
RL
VO(PP)
fc
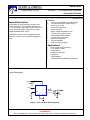
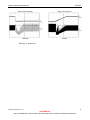
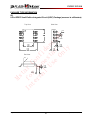
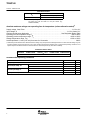
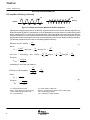
Figure 36. Single-Ended Configuration and Frequency Response
Increasing power to the load does carry a penalty of increased internal power dissipation. The increased
dissipation is understandable considering that the BTL configuration produces 4× the output power of the SE
configuration. Internal dissipation versus output power is discussed further in the crest factor and thermal
considerations section.
single-ended operation
In SE mode (see Figure 36), the load is driven from the primary amplifier output for each channel (OUT+).
The amplifier switches single-ended operation when the SE/BTL terminal is held high. This puts the negative
outputs in a high-impedance state, and effectively reduces the amplifier’s gain by 6 dB.
BTL amplifier efficiency
Class-AB amplifiers are inefficient. The primary cause of these inefficiencies is voltage drop across the output
stage transistors. There are two components of the internal voltage drop. One is the headroom or dc voltage
drop that varies inversely to output power. The second component is due to the sinewave nature of the output.
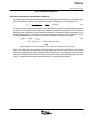
The total voltage drop can be calculated by subtracting the RMS value of the output voltage from VDD. The
internal voltage drop multiplied by the RMS value of the supply current (IDDrms) determines the internal power
dissipation of the amplifier.
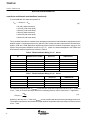
An easy-to-use equation to calculate efficiency starts out as being equal to the ratio of power from the power
supply to the power delivered to the load. To accurately calculate the RMS and average values of power in the
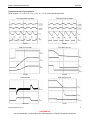
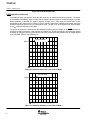
load and in the amplifier, the current and voltage waveform shapes must first be understood (see Figure 37).
www.ti.com
27