1
42
Summarizing Data
Chapter Summary
Chapter 3
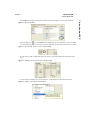
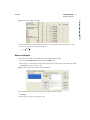
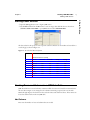
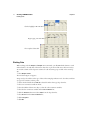
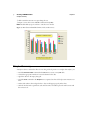
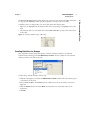
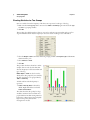
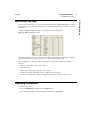
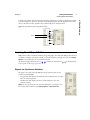
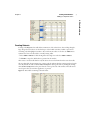
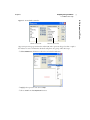
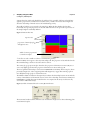
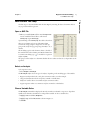
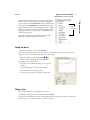
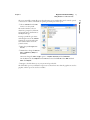
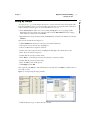
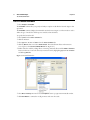
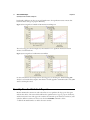
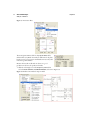
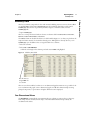
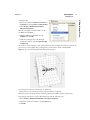
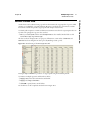
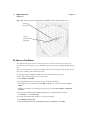
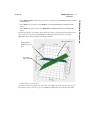
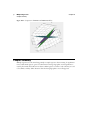
Figure 3.10 Labeling Ideal Points
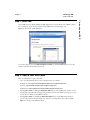
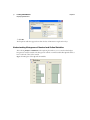
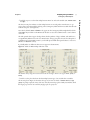
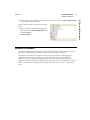
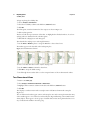
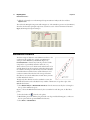
As a final step, use Analyze > Fit Y by X to look again at the two scatterplots that compare costs.
Select Analyze > Fit Y by X.
Assign $/lb Protein as Y.
Assign both $/oz and Protein/Fat as X.
Click OK.
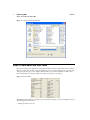
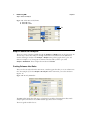
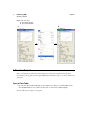
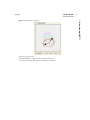
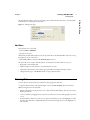
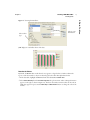
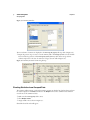
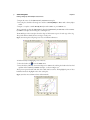
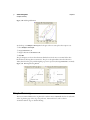
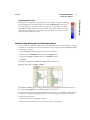
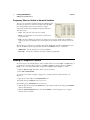
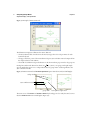
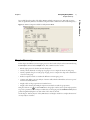
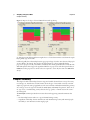
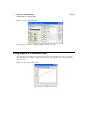
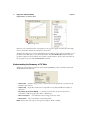
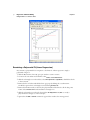
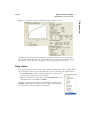
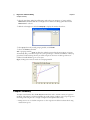
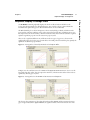
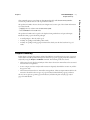
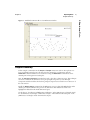
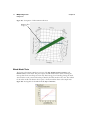
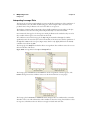
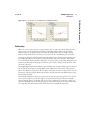
The plot in Figure 3.11 shows that the Estate Chicken brand is the most economical of the three
labeled brands (showing $/oz as continuous). The plot to the right indicates that the Calorie-less
Turkey brand is in the group with the highest proportion of protein (showing Protein/Fat as nominal).
Figure 3.11 Winning Hot Dog Brands.
Chapter Summary
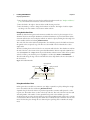
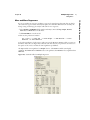
This lesson examined different hot dog brands for a cafeteria menu. A JMP table has data for 54 brands
of hot dog showing type of hot dog, taste preference, nutritional factors, and cost factors.
To find the ideal hot dog, we did the following: