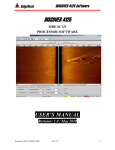
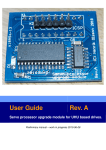
1
Bathyswath Getting Started Bathyswath Email: support@bathyswath.com, Web: www.bathyswath.com 5733 Issue 4.2 July 2013 Bathyswath . This is an unpublished work, the copyright in which vests in Bathyswath . All rights reserved. The information contained herein is the property of Bathyswath and is supplied without liability for errors or omissions. No part may be reproduced or used except as authorized by contract or other written permission. The copyright and the foregoing restriction on reproduction and use extend to all media in which this information may be embodied. Bathyswath Getting Started Contents This Page Intentionally Left Blank Issue 4.2 July 2013 Page ii Bathyswath Getting Started Contents Contents Contents iii Preface For new users vii vii 1 Health & Safety 1.1 Caution 1.2 Important Notices 1.3 Safety Training 1-1 1-1 1-1 1-3 2 Quick Start 2.1 Online Help 2.2 Installation 2.3 Turning On 2.4 Starting the Software 2-1 2-1 2-1 2-1 2-1 3 General Description 3.1 System Description 3.2 Principle of Interferometric Sonar 3.3 The Advantages of Bathyswath 3.4 System Functions 3.5 Hardware 3.6 Software 3.7 Other Software Systems 4 System Capabilities 4.1 Sonar Range 4.2 Accuracy 4.3 Line Spacing 4.4 Pulse Repetition Frequency 4.5 Vessel Speed and Along-track Coverage 4.6 Media Usage 4.7 Interferometry 5 Hardware Installation and Deployment 5.1 Equipment List 5.2 System Details 5.3 Power Requirements 5.4 Switching Mains Input Voltage 5.5 PC Installation 5.6 Workstation Peripheral Devices Installation 5.7 SWATHplus ISA Interface Card 5.8 Bathyswath Transducer Interface Unit (TIU) Installation 5.9 Grounding and Earthing 5.10 Installing Position, Heading and Attitude Subsystems 5.11 Wet-end Deployment 5.12 Transducer Installation – General Issue 4.2 July 2013 3-1 3-1 3-3 3-3 3-4 3-7 3-9 3-12 4-1 4-1 4-3 4-4 4-4 4-5 4-5 4-6 5-1 5-1 5-2 5-3 5-5 5-5 5-5 5-7 5-7 5-7 5-9 5-14 5-14 Page iii Bathyswath Getting Started Contents 5.13 5.14 5.15 5.16 5.17 Issue 4.2 Hull Mounted Configuration Bow-mount Configuration Side-mount Configuration Buoy Mount Final Tests and Measurements 5-15 5-17 5-19 5-22 5-22 6 System Configuration and Timing 6.1 Background 6.2 PPS Input to TEMs 6.3 System Configurations 6.4 Sensor Clock Timing Configuration 6.5 PC Clock Timing Configuration 6.6 Monitoring System Timing 6-1 6-1 6-2 6-4 6-4 6-6 6-8 7 Software Installation 7.1 Installation 7.2 PC Configuration 7.3 To Install USB TEMs 7.4 Software Settings Files 7.5 Starting the Software 7.6 Using the Software 7.7 Use with Real-Time Third-Party Applications 7-1 7-1 7-2 7-3 7-4 7-5 7-5 7-5 8 Using Bathyswath for Surveying 8.1 Checks Before Surveying 8.2 Sensor Misalignment (Patch) Test 8.3 Positioning System Confidence Checks 8.4 Crosslines 1.2 Routine Survey Checks 1.3 Uncertainty Budget Analysis for Depths 8.5 Environmental Measurements 8.6 Running Survey Lines 8-1 8-1 8-3 8-6 8-6 8-6 8-6 8-8 8-9 9 Post Processing Software 9-1 10 Maintenance 10.1 Daily, and Before Leaving Port 10.2 Weekly, and Before Each Survey 10.3 Monthly, (or less often, depending on conditions) 10.4 Yearly 10.5 Transducer Checks 10.6 Transducer Connector Diagrams 10-1 10-1 10-2 10-3 10-3 10-4 10-4 11 Specifications 11.1 Summary 11.2 Power Requirements 11.3 System Performance 11.4 System Weights 11.5 Transducer Dimensions 11-1 11-1 11-1 11-2 11-2 11-2 July 2013 Page iv Bathyswath Getting Started Contents 11.6 Transducer Frame Dimensions 12 Reference 12.1 Glossary 12.2 Bathyswath Web Page 12.3 Bathyswath Support Issue 4.2 July 2013 11-5 12-1 12-1 12-4 12-4 Page v Bathyswath Getting Started Preface Preface This Bathyswath User Documentation covers the Bathyswath-H, -M and –L products. Other Bathyswath products, including Bathyswath RS100, and Bathyswath-Gavia have separate user documentation. This document supports use with the Bathyswath-SPLASH system, which is also supplied with a separate manual for the Helmsman display and SPLASH hardware. The Bathyswath documentation is divided into two main parts: Getting Started - the paper part of the documentation, which introduces Bathyswath and covers aspects such as software and hardware installation and deployment. Online User Guide - covering all aspects of using the Bathyswath as a hydrographic surveying tool. The guide is accessed from the Swath Processor Help menu. It can also be accessed directly from the Swath Processor software by using the ‘F1’ key on the computer keyboard, to provide context-sensitive help. In addition, there are: Grid Processor manual – this provides instruction for using the Bathyswath Grid Processor program. Installation instructions – the software and other components are supplied with specific installation instructions, which build on the installation guides provided in this manual. Auxiliary equipment manuals – If Bathyswath is supplied with auxiliary equipment, such as attitude sensors, positioning systems and compasses. These will be supplied with their own manuals and/or online guides, and the operator should read these before using the system. For new users We suggest you start by reading this document as an introduction to Bathyswath. Once the Bathyswath software is installed, you can access the Online User Guide from the Help menu of the software. The online information is provided in topics and has been structured to lead you through using Bathyswath as a hydrographic surveying tool. You can find information via the contents, index or full text search. From any topic, you can follow the hyperlinks (shown in coloured text and underlined) to see additional information on the same topic or related topics. Section 2 provides a Quick Start guide for first-time users of Bathyswath. All Bathyswath users should carefully read the safety instructions in section 1. Issue 4.2 July 2013 Page vii Bathyswath Getting Started Contents This Page Intentionally Left Blank Issue 4.2 July 2013 Page viii Bathyswath Getting Started Section 2 Quick Start 1 Health & Safety 1.1 Caution The information given in this manual is the best that is available at the time of issue but must be used with discretion. The text in this manual does not override statutory requirements concerning good work practices or safety precautions. All warning signs on equipment must be obeyed. Where the symbol appears in the margin, special attention should be given to health & safety considerations. 1.2 Important Notices All personnel are required to study these notices and familiarise themselves with all applicable safety precautions and bring them to the attention of others in the vicinity. 1.2.1 Lethal voltage warning LETHAL VOLTAGE WARNING VOLTAGES WITHIN THIS EQUIPMENT ARE SUFFICIENTLY HIGH TO ENDANGER LIFE. COVERS MUST NOT BE REMOVED EXCEPT BY PERSONS QUALIFIED AND AUTHORISED TO DO SO AND THESE PERSONS SHOULD ALWAYS TAKE EXTREME CARE ONCE THE COVERS HAVE BEEN REMOVED. A current of 100 milliamps passing through the human body for one second can kill. This can occur at voltages as low as 35V ac or 50V dc. Some Bathyswath equipment uses electrical power that can be lethal. Whenever practicable, before carrying out installation, maintenance or repair; personnel involved must: 1. Isolate the equipment from the electrical supply. 2. Make tests to verify that the isolation is complete. 3. Ensure that no one can accidentally reconnect power. If it is essential to work on the equipment with power connected, work must only be undertaken by qualified personnel who are fully aware of the danger involved and have taken adequate safety precautions to avoid contact with dangerous voltages. 1.2.2 Use environment The standard Bathyswath Transducer Interface Unit is intended for use on-board in a protected area and not directly exposed to the outside environment. The Bathyswath-SPLASH unit is designed for use in areas exposed to rain or splashes from waves. Do not mount the Bathyswath-SPLASH housing in location that is, or is at risk of, being submerged under water. Issue 4.2 July 2013 Page 1-1 Bathyswath Getting Started Contents 1.2.3 Compass safe distance It is recommended that the Bathyswath equipment be installed greater than 5m from a standard or steering magnetic compass. This equipment has not been tested or verified as meeting the compass safe distance specification in EN60945. 1.2.4 EMC requirement conformity The Bathyswath Transducer Interface Unit meets the EMC (electromagnetic compatibility) requirements of EN60945, and is therefore ‘CE marked’. 1.2.5 Safety on deck At all times when working on deck, observe all reasonable safety precautions. The following is a guide to safe working practice: 1. 2. 3. 4. 5. On deck, wear hard hats at all times. On deck, wear life vests and safety lines at all times. On deck, suitable deck boots or safety boots/shoes must be worn at all times. On deck, wear suitable clothing at all times. Do not work alone on the deck. A minimum of two operators is required, with the second operator observing. 6. When working during the hours of darkness, suitable flood lighting must be available to cover the area of operation. It is the responsibility of all personnel to take all reasonable precautions to ensure their own safety and that of others working with them. 1.2.6 Safety aloft If required to work aloft (i.e. installing GPS etc.), personnel must bring this to the attention of someone in authority at deck or at ground level. Place warning notices that work aloft is in progress. Ensure that the means of access aloft is secure and beware of wet or slippery ladder rungs and working areas. When working on or near a radar scanner and other moving or radio frequency radiating equipment, ensure that they are switched off and that the fuses have been removed and retained. 1.2.7 Personal protection Whenever the possibility of an uncontrolled hazard exists, wear personal protection. For example, wear suitable gloves when handling deck-cables, etc. Other items of protection include hard hats, life vests, ear protection, work overalls and safety glasses. 1.2.8 Health hazard The inhalation of dust and fumes or any contact with lubricants when cleaning the equipment may be temporarily harmful to health, depending on individual allergic reactions. Treat with caution components that are broken or overheated as they may release toxic fumes or dust. Do not inhale the fumes and ensure that the dust and debris do not enter open cuts or abrasions. It is prudent to regard all damaged components as being potentially toxic, requiring careful handling and appropriate disposal. 1.2.9 Radiation hazard: non-ionising Most countries accept that radio frequency (RF) with mean power density levels up to 10mW/cm present no significant hazard. RF power levels in excess of this may cause harmful effects, particularly to the eyes. No part of the Bathyswath equipment produces this level of radiation. 2 Users of cardiac 'pacemakers' should be aware that radio frequency transmissions might damage such devices or cause irregularities in their operation. Persons using a 'pacemaker' should ascertain whether their device is likely to be affected before exposing themselves to the risk of a malfunction. Issue 4.2 July 2013 Page 1-2 Bathyswath Getting Started Contents 1.2.10 Divers Do not fire sonar transmit signals into the water when divers are working nearby. 1.2.11 Environmental impact: marine mammals The Bathyswath sonar frequencies are above the frequencies and below the power levels that are known to cause harm and distress to marine mammals. Nevertheless, caution should be exercised in areas known to be used by whales and dolphins. 1.3 Safety Training Most countries with an offshore industry have organisations that offer training in offshore safety. Many companies that carry out work offshore require that workers should possess an up-to-date certificate of such training. We strongly recommend that operators obtain the appropriate safety training. Issue 4.2 July 2013 Page 1-3 Bathyswath Getting Started Section 2 Quick Start 2 Quick Start This section is aimed at new users of Bathyswath, and gives a step-by-step guide on how to use Bathyswath for the first time. We recommend that new users read section 3, General Description, before starting to use the system. If you are using the system operationally, on the water, carefully read section 1, Health & Safety. 2.1 Online Help The main reference for Bathyswath is the online help. This quick start guide takes you as far as starting up the software, to the point where you can use the online help alongside the software. 2.2 Installation See section 6 for instructions on installing software. 2.2.1 Survey or Post-Processing If you are using Bathyswath straight away for surveying, you will first need to install the system hardware (read section 5). If the software is being used for post-processing or training, it can be used without the Bathyswath hardware. 2.3 Turning On If you are running the Bathyswath software without the survey hardware on your desktop or laptop computer, proceed to section 2.4. Before turning anything on, perform a quick safety check; see section 10.1.1. Make sure that the system power is active: this might be DC or mains. Turn on all the auxiliary systems: such as attitude system, position system, and compass. If starting up in cold and/or damp conditions, particularly if the temperature is below freezing, use the cabin heater to bring up the conditions to a temperature above freezing, and so that there is no condensation on internal surfaces. Otherwise, as the computer and electronics warm up, they may experience internal condensation, which could cause damage. Turn on the system computer. Turn on the Transducer Interface Unit (TIU): the ‘blue box’. 2.4 Starting the Software The Bathyswath installer places shortcuts to the software in the Windows Start menu. Click on the start menu in the bottom-left corner of the screen, select ‘Programs’, ‘Bathyswath, then ‘Bathyswath’, and finally click on ‘Online Help’. This is the online help system. Find the ‘Welcome’ page, and go from there. Issue 4.2 July 2013 Page 2-1 Bathyswath Getting Started Contents The main Bathyswath programs, the ‘Swath Processor’ and ‘Grid Processor’ can also be started from the ‘Bathyswath’ start menu, as can a soft-copy of this ‘Getting Started’ manual. These programs can also be started by double-clicking on file icons for the Swath Processor ‘session files’ (*.sxs) and the Grid Processor grid files (*.sxg) in Windows Explorer. See section 7.2 for more detailed instructions on starting the software. Issue 4.2 July 2013 Page 2-2 Bathyswath Getting Started Section 3 General Description 3 General Description 3.1 System Description Bathyswath is a wide-swath bathymetry and sidescan imaging system. The basic sonar system consists of the following components: Transducer Interface Unit (TIU). This contains the main system electronics, and connects the sonar transducers to a PC computer. In the Bathyswath-SPLASH version, the electronics are provided in a splash-proof housing, for use on open vessels, or on the deck. Bathyswath-SPLASH also includes an integral computer. See Figure 3-2. Sonar transducers: one facing port, and one facing starboard. In the base system, the user mounts the transducers to a suitable location on their vessel. Additional mounting hardware is optionally available: see below. Bathyswath software suite, provided on CD for installation on the Customer’s PC computer. The Bathyswath software supports real-time data acquisition, post-processing, and interfaces to most third-party software suites. Figure 3-1 The Bathyswath base system comprises a Transducer Interface Unit (left shows one type- others are available) and two sonar transducers (Bathyswath-H shown right). Issue 4.2 July 2013 Page 3-1 Bathyswath Getting Started Section 3 General Description Figure 3-2 The Bathyswath SPLASH base system Further optional components include: Transducer mounting bracket: a ‘V’ bracket, which holds the two transducers at the correct mounting angles. For dedicated use on a small vessel or platform, the user may prefer to mount the transducers directly onto the platform. The two transducers should be fixed facing downwards at an angle of approximately 30° from the horizontal, with one facing port and the other starboard. In this case, the transducer mounting bracket is not required. Transducer drawings and further advice are available from Bathyswath on request. Transducer pole: this allows the mounting bracket to be mounted over the side of a vessel, or similar. It is provided in four easily separated sections, for easy transport. Bow-mounting kit: fixes the transducer pole to the bow of a vessel; includes an anglebracket, which holds the transducers level on a sloping bow. Laptop computer, configured for use with Bathyswath. This can be used for preparing survey session plans, and for post-processing collected data. It is provided complete with an Ethernet-to-serial unit, for interfacing to auxiliary sensor systems. Bathyswath is available in three sonar frequencies. The 468 kHz version is most applicable to very small platforms, due to the small size and light weight of the transducers, and the higher spatial resolution of the imaging. Issue 4.2 July 2013 Page 3-2 Bathyswath Getting Started Section 3 General Description 3.2 Principle of Interferometric Sonar A swath system sends out sonar signals either side of the ship in a beam that is wide in the vertical direction but narrow in the horizontal direction. These beams form a ‘footprint’ on the seabed that is a narrow strip at right angles to the direction of travel. As the ship moves forwards, a ribbon-shaped swath of seabed measurements is built up. Bathyswath simultaneously measures two kinds of information: Direction of the echoes from the seabed. Signal strength. The first is used to measure depth (bathymetry) and the second is used to provide a black-and-white image (sidescan). Figure 3-3 Multiple ping footprints build up a swath as the sonar moves forwards The direction of the echoes is measured by comparing the phase of the signal as it arrives at several vertically-separated transducer ‘staves’. A stave is a horizontal row of transducer elements. Phase measurements on a small number of channels provide a simple, robust and high-resolution measure of the angle to the seabed. 3.3 The Advantages of Bathyswath Bathyswath not only provides the benefits associated with other swath bathymetry sonars, but also it has several unique advantages. 3.3.1 Wide swath width Bathyswath measures depths across a wide track, giving high resolution and accuracy. Both these factors mean that the time taken to survey an area with sufficient coverage for engineering and hydrographic use is greatly reduced, when compared with conventional surveying techniques. Bathyswath is capable of providing total ensonification of the bottom at practical and efficient survey speeds. Figure 3-4 Coverage comparison Bathyswath and Beamforming Multibeam Echosounder Issue 4.2 July 2013 Page 3-3 Bathyswath Getting Started Section 3 General Description 3.3.2 Simultaneous pinging Bathyswath provides the option to ping on both port and starboard transducers simultaneously, thus offering the ability to double the productivity and along-track coverage of competing interferometric systems. 3.3.3 Portability Bathyswath may be configured as a portable system, which means that it may be deployed from almost any vessel. This eliminates the need for expensive modifications to survey vessels, with the associated tying-up of capital investment in a single vessel, and allows the system to be transported anywhere in the world. Bathyswath can be used with laptop computers. Its electronic components weigh a few kilogrammes and take power of less than 25W. 3.3.4 High resolution and accuracy Compared with beamforming swath sounding systems, Bathyswath takes many more depth measurements per hour, thus giving greater resolution and coverage, and allowing greater scope for statistical filtering of the measurements. Furthermore, the angle at which depths may be measured is not limited to a fixed arc, so that much wider coverage can be obtained in shallow water, even allowing measurements to be made of shoreline structures. A beamformer suffers from poor resolution at far range, where the footprint of its beams is very large due to the small strike angle with the seabed. Bathyswath avoids this problem, as the area of the energised patch of seabed does not increase dramatically as it moves away from the transducers. 3.3.5 Simultaneous side scan Bathyswath also produces high quality sidescan data simultaneously with bathymetry. The range and quality of the sidescan data is comparable with that from sidescan-only systems. The sidescan information helps with the interpretation and processing of bathymetric data, and the bathymetry enables the sidescan information to be correctly located on the seabed, avoiding the usual ‘flat seabed’ approximation used in sidescan-only systems. 3.3.6 Mid-water objects and structures Bathyswath can detect objects in mid-water and on the surface, as well as the bottom. The Bathyswath processing software allows such objects to be mapped and visualised in 3D. The high resolution of the system makes it ideal for this application. Measuring the amplitude of return as well as bathymetry allows small, hard, mid-water targets to be differentiated from ‘noise’. Applications of this capability include scanning the hulls of vessels, for example for homeland security and anti-drug enforcement, or for monitoring sub-sea engineering structures, including port facilities, pipelines and oilfields. 3.3.7 Frequency variants of the Bathyswath Bathyswath systems are available in three frequency variants. These are 117kHz, 234kHz and 468kHz, called Bathyswath-L, -M and –H respectively. These stand for ‘low’, ‘medium’ and ‘high’. Because of the acoustic properties of water, the choice of frequency depends on the depth of water to be surveyed and the resolution demanded by the end-user’s application. The low-frequency variant provides longer range and measurement than the higher frequency system, but the highfrequency systems can resolve smaller objects. 3.4 System Functions 3.4.1 Sounding repetition rate The user may set the sounding repetition rate on-line, to set the nominal range of the sonar. With a twin transducer system, the swath width is twice this range. A 300m range corresponds to a ping repetition frequency (PRF) of around 2.5Hz (times per second). A 70m range gives a PRF of 10.7Hz. The time to gather a full swath at a given nominal range depends on the speed of sound. Issue 4.2 July 2013 Page 3-4 Bathyswath Getting Started Section 3 General Description The operator can select the PRF required to maximise along-track coverage for the required swath width. 3.4.2 Motion sensors Swath bathymetry requires that the full motion (also known as attitude) of the vessel be recorded. The essential parameters are roll, pitch, heave, heading and position. Bathyswath is fully compatible with, amongst others, CodaOctopus F180, Applanix POS/MV, Ixsea Octans, Kongsberg Seatex Seapath and MRU-5 and MRU-6, TSS DMS-05 motion reference units (MRU) and SMC S-108, with interfaces to either the launch’s own gyro-compass, or a magnetic compass. These units measure roll and pitch to an accuracy of 0.025° or better. Users can select the motion, position and heading systems to suit their budget, accuracy requirements, and the dynamic properties of their survey vessels. 3.4.3 Positioning The position of the sonar sensor also needs to be measured. Bathyswath interfaces to a wide range of position sensors. Most such sensors are based on GPS satellite positioning. Some sensor systems provide motion (attitude), heading and position as an integrated package. Such systems have a number of advantages: they are more accurate, because each measurement can be used to improve the processing of the others, and the attitude components can be used to update the position information when GPS signals are temporarily lost, for example if the vessel passes under a bridge. Positioning information is accepted in both angular (latitude and longitude) format and grid projection (easting and northing). A range of conversion parameters and ellipsoids is available to the operator. 3.4.4 Speed of sound Bathyswath provides interfaces to both a speed of sound profiler and a continuous reading speed of sound meter. The profiler is used by the surveyor at suitable intervals, to measure speed of sound at intervals of depth. This is used by the system software to correct for refraction of the sound as it passes between layers of water with different sound speeds. The continuous reading meter is mounted near the sonar transducers. It ensures that the sound signals are correctly converted to measurements of angle. The profiler is essential, but the continuous reading meter is only necessary if the speed of sound at the surface changes strongly within the survey area. 3.4.5 Tide and vertical position In order to relate the depths measured by the sonar system to a chart datum height, for example, LLWS (lowest low water springs) sea level, or position height datum (e.g. WGS-84), the height of the sensor needs to be measured in real time. Bathyswath supports two ways of doing this: Tide measurements: the height of the sensors relative to the water surface is measured, using measuring tape or equivalent methods, and entered as an offset in software. The height of the water surface relative to datum, against time, (i.e., a tide table) is recorded and entered into the processing software. This tide information can come either from recording or real-time tide sensors, or from published tide tables. For accurate work in inshore waters, more than one tide sensor is needed, including offshore tide buoys. The Bathyswath software can integrate between such multiple tide sensors in both position and time. GPS height measurements: if the positioning system is able to provide height information at the accuracy required by the users’ application, then this information can be used in processing instead of tide. However, standard GPS and differential GPS (DGPS) systems do not usually provide height to sufficient accuracy; a system such as real-time kinematic (RTK) is needed. In either case, heave measurements from the motion sensor are merged with the height measurements in the Swath software. For use in underwater vehicles, pressure depth can be merged into the vertical position. Issue 4.2 July 2013 Page 3-5 Bathyswath Getting Started Section 3 General Description 3.4.6 Echosounders Serial data outputs from single-beam echosounders can be logged by the Bathyswath software. The depth information from the echosounder can be corrected for motion and position, and placed in the gridded depth model for comparison or inclusion with the swath data. The echosounder could be used to add to and provide a quality check for the data in the nadir region, directly under the transducers. Bathyswath already produces some data in the nadir, although it is sparser than further out along the profile. An echosounder adds one point. However, there could be quality control benefits in having an independent measure of depth. Possible problems include: Acoustic interference between the two systems; it is advisable to place the two systems in locations on the survey vessel so that interference is minimised, or to set up a synchronisation signal between the two systems. Bathyswath can be configured to output such a synchronisation pulse. The acoustic ‘footprint’ of an echosounder is usually bigger than that of Bathyswath, and its data filtering will be different. Therefore, the echosounder may not be the most reliable data source if it disagrees with Bathyswath. 3.4.7 Other sensors Bathyswath provides interfaces to a range of other sensors and systems. These include: An arbitrary data stream, which is time-tagged and logged with the sonar data. The information in this stream can be extracted and used for the operator’s own purposes during post-processing. Acoustic Ground Discrimination Systems (AGDS) Tide: on-line tide information can be logged and used for processing. 3.4.8 External control Bathyswath can be controlled by external systems, either through an RS232 serial line or by TCP/IP, for example through an Ethernet link. 3.4.9 Software functions Bathyswath provides all the hardware and software functions needed to produce bathymetric information. In addition, it is provided with links to many industry-standard software packages. 3.4.10 Standardised data output In real-time, Bathyswath data is recorded in both a generic data format, and as ‘end product’ files. The latter file format is selected to suit the post-processing system chosen. The Processing/Q.A. off-line software can export data in x,y,z and gridded digital terrain model (DTM) formats, and as depth-and-contour graphics. These outputs are available in common forms, including ASCII. 3.4.11 Sidescan seafloor imaging Bathyswath provides sidescan imaging, with bathymetry fully co-registered. Imaging data may be displayed on the PC screen. Bathyswath also provides links to several commercially available sidescan-processing platforms. 3.4.12 Wreck and object detection The imaging function of the Bathyswath allows the operator to detect and identify objects on the seabed, including wrecks. The use of sidescan and colour-coded swath bathymetry displayed sideby-side or merged is an extremely powerful tool for this task. The commercial sidescan processors referred to above also provide the opportunity for extended capabilities in this area. Issue 4.2 July 2013 Page 3-6 Bathyswath Getting Started Section 3 General Description 3.4.13 Seafloor sediment classification The combination of swath bathymetry and sidescan imaging allows the user to identify the type of seabed being surveyed. Automatic seabed classification is being further developed in co-operation with several organisations, both academic and commercial. 3.5 Hardware 3.5.1 General description The main components of the Bathyswath are sonar transducer(s), Transducer Electronics Module(s) (TEMs) in a Transducer Interface Unit (TIU), and a PC computer. Data is recorded by the PC computer onto disk. Data may be archived onto standard PC e.g. stored on an external (USB) disk drive. PC Computer Auxiliary Sensors Position Motion Sensor Compass Electronics Transducer Electronics Modules (TEMs) in Transducer Interface Unit (TIU) Interface the sonar transducers to the PC, and - Produce transmit signal - Amplify received signal - Digitise signal and transmit it to PC Sonar Transducers Piezo-electric elements, arranged in horizontal rows. No active electronic components. Encased in nylon or polyurethane Figure 3-5 Bathyswath Hardware Block Diagram 3.5.2 Transducer Electronics Modules (TEMs) The Transducer Electronics Modules connect the sonar transducers to the PC computer. One Transducer Electronics Module is used for each sonar transducer. Each Transducer Electronics Module (TEM) contains a single printed circuit board (PCB), with flexible connections to the computer and sonar transducer. It is thus extremely robust. The TEM on-board data processing is implemented in a large FPGA. The TEM PCB has sub-sections performing the following functions: Issue 4.2 Transmitter, which sends an electrical pulse to the sonar transducers. This makes the sonar pulse. Analogue Receiver, which amplifies the returned echo signals, and produces sidescan amplitude data. The Bathyswath analogue circuits provide very high gain and low noise, enabling signals below acoustic sea noise to be measured. The limiting factor to performance is therefore determined only by the external environment. Phase Interface, which receives the amplified sonar signals, measures the phase differences between them and converts the sidescan data into digital form. July 2013 Page 3-7 Bathyswath Getting Started Section 3 General Description 3.5.3 Transducer Interface Unit (TIU) Two or three TEMs may be supplied housed in a Transducer Interface Unit (TIU). This brings the TEM inputs and outputs out to a single connection plate and supplies power to the TEMs from a 100-240V mains supply or 12-24V DC power supply. 294 USB-A 125 A USB-B B Transducer Interface Unit Sync PPS 110-240V AC Figure 3-6 Transducer Interface Unit: “blue box” type In the Bathyswath-SPLASH version, the TEMs are provided in a watertight housing. Other types of Bathyswath TIU are available, including a splash-proof housing and a 19” rack. 3.5.4 USB system interface Each Transducer Electronics Module (TEM) is connected to the PC computer using an industrystandard USB connection. Up to 4 TEMs can be connected to one PC, although two or three are the usual number. If the sonar system needs to be mounted at a distance from the computer, then the USB interface can be extended using a commercial USB extender or USB-to-Ethernet converter. Alternatively, a remote compact computer unit can be installed close to the sonar system and auxiliary sensors, which then acts as a data storage and control unit for the sonar. This remote unit can then be operated over a network link, either cable or Wireless, using standard remote interface software. This latter option is useful for remote systems, such as USVs (unmanned surface vehicles), UUVs (unmanned underwater vehicles) and towed vehicles. 3.5.5 Software The Bathyswath software operates in Windows 7, Vista, XP and 2000. Commands may be entered via the mouse and keyboard. A wide range of displays is available, which allow the operator to monitor and control the operation of the sonar system. 3.5.6 Auxiliary interfaces The operating software supports ports to allow real time interfaces to other survey suite sensors, including Motion Measurement, Position (DGPS / RTK DGPS) and Heading (NMEA 0183 format). It also supports multiple information streams from integrated systems such as the CodaOctopus F180. Tide height information can be input manually either from a telemetry system or in post processing. Water speed of sound profiles may be input manually after speed of sound dips or in post processing. Interfaces are supported using RS232 serial ports and Ethernet UDP ports. Not all attitude sensors provide Ethernet interfaces, but where they do, they are preferable because they are faster, and therefore the delay between sending and receiving is shorter, and because they contain more information. For example, such interfaces generally attach the time at which the data was valid with the string. This allows the Bathyswath user to opt to use the sensor time for processing, rather than the PC time. See section 6 for details. Issue 4.2 July 2013 Page 3-8 Bathyswath Getting Started Section 3 General Description 3.5.7 Personal Computer (PC) The PC serves as the man-machine interface. Commands may be entered via the mouse and keyboard. A wide range of displays is available, which allow the operator to control and monitor the operation of the sonar system. 3.5.8 Ship hull mount configuration This configuration is used where the Bathyswath is to be permanently mounted on a vessel, and where a pole mount is not required. See section 5.13. 3.5.9 Pole mount configuration This configuration is used when a permanent hull mount is not required. The ‘wet end’, consisting of the transducers and the attitude sensor in a watertight pod, is mounted on a special plate at the end of a rigid pole. The pole is deployed over the side, or on the bow, of the vessel. The pole can be hinged or retractable, so that the system and the ship are not at risk in shallow water. Alternatively, the Bathyswath can be deployed through a moon pool or gate valve. See sections 5.14 and 5.15. 3.5.10 Use on very small boats Bathyswath can be used from very small boats, including open ‘Zodiac’ type inflatables and RIBs, and can be configured to use DC power from a battery, rather than mains power. The higher frequency transducers are smaller and lighter than the low frequency ones, and are thus more suitable for this application. A carefully selected system of Bathyswath with laptop and lightweight auxiliary sensors can weigh less than 10kg and consume less than 25 Watts. The Bathyswath-SPLASH option is best suited for open boats, as its electronics housing is splashproof. 3.5.11 Use on remote platforms Bathyswath has been used on a range of remote and underwater platforms, including unmanned surface vessels (USVs) and unmanned/autonomous underwater vehicles (UUVs/AUVs). It is also ideal for use on remotely operated vehicles (ROVs). 3.6 Software 3.6.1 Introduction Bathyswath acquires, processes and displays data whilst a survey is underway, using a program called the Swath Processor (‘Swath’). This also allows for control and set-up of the system, and gives error diagnostic information. The software stores data in two forms: ‘raw’ and ‘processed’. The raw data is exactly as it was acquired by the system, unfiltered and unprocessed. The processed data is filtered, and then written out in a file format that suits the post processing system being used. Post processing software converts the data acquired in real-time into digital depth models. These depth models are used to produce displays and plots of the surveyed area. Users may select to use Bathswath post processing software, or a third-party program, to suit their application. The Swath program is used to provide the first pass of post-processing when using the Bathyswath software. It reads its own raw data files, and produces processed data files. The second pass of the post-processing converts the processed swath data files into digital terrain models. This program is called ‘Gridproc’. Gridproc also allows 3D visualisation, filtering, data correction and calibration functions. See section 6 for instructions on installing the software. Issue 4.2 July 2013 Page 3-9 Bathyswath Getting Started Section 3 General Description bathymetry (ASCII) reflectivity (ASCII) Gridproc processed data (SXP file) Bathyswath SONAR Other mapping tools bathymetry (plot images) reflectivity (plot images) Swath Semi-raw data (SXI TCP/IP) raw data (SXR file) plot images Sidescan (reflectivity) (plot images) Sonar Controls Processed data (ASCII, SXP, SXI, GSF) Other mapping tools Other realtime survey tools SWATHplus Helmsman Display Figure 3-7 Bathyswath Software Tool Flow 3.6.2 Swath software Swath runs on a PC computer, and performs all the real-time functions. These include: Controlling the sonar electronics system Acquiring data from the sonar electronics system Acquiring data from the auxiliary systems, through the PC's serial ports Storing all the raw data Converting the raw data to depth, position and amplitude (xyza), combining auxiliary data, such as motion, position, heading, tide and speed of sound. Filtering the data to remove noise and unwanted targets Displaying the data Storing processed xyza data in a range of formats All of these functions are controlled by the operator using parameters that are stored in a ‘session file’. This allows the operator to store the parameters used on a particular project. In addition, the configuration parameters used to generate a particular processed data set are automatically stored in the processed data file. This feature is only available in the Bathyswath processed data file format. There is an extensive on-line help system to assist the user with all aspects of using the Bathyswath. This is, in effect, an on-line manual. You can access this by clicking on the Contents option on swath’s Help menu. Issue 4.2 July 2013 Page 3-10 Bathyswath Getting Started Section 3 General Description Waterfall, Diagnostic, etc., Displays Session File (.sxs) 2D & 3D Displays Processed Data File (.sxp) Sonar System Swath Processor Grid Processor XTF File (.xtf) Raw Data File (.sxr) Parsed Data File (.sxi) Grid File (.sxg) ASCII xyz (.txt) TCP/IP Third-Party Software Tools (optional) Figure 3-8 Swath Software Block Diagram 3.6.3 Grid Processor software The Grid Processor (‘Gridproc’) program runs off-line, either after the survey on the survey PC, or on a separate PC computer. It performs the following functions: Placing all the processed data (depth and amplitude) into a gridded digital terrain model (DTM) Displaying depth and amplitude for each node of the grid Displaying statistical information about the depths in each node of the grid, including mean, standard deviation, range and data count The data for each ping and line of the survey are stored separately in the grid, allowing simple comparison of overlapping data sets. The data from overlapping survey lines is compared to provide automatic post processing calibration. This includes derivation of the roll offset between transducers. This calibration information is stored in the session file for subsequent re-processing of the raw data with the swath program. Filtering and moving the data in the grid, to enable the operator to quickly and easily clean and correct the processed data. 3D views of the data in the grid, allowing the operator to see the seabed in three dimensions, and to ‘fly’ across the seabed using the mouse or in pre-defined routes. The grid can be edited in the 3D mode, using the mouse to ‘lasso’ points and groups of points that are not required, for example mid-water targets. Grid data can be stored in ‘point cloud’ format. In this mode, every data point from the Swath program is retained in the grid. Although memory-intensive, this allows for high-resolution views. In this mode, the views are not restricted to a single surface, and so complex objects and mid-water targets can be imaged. Issue 4.2 July 2013 Page 3-11 Bathyswath Getting Started Section 3 General Description Processed Data File Gridproc Grid File Display Further processing Charting Figure 3-9 Gridproc Software Block Diagram 3.6.4 Calibration and offset correction functions Bathyswath provides facilities to calculate instrumental and positioning offsets and alignments. Such calibrations use surveyed data, and provide accuracy of calibration to allow the survey system to meet the overall accuracy requirements. All calibration parameters are available for changing and can be reapplied at the processing stage. The changing of calibration parameters does not change the raw stored data file. 3.6.5 Data formats The Bathyswath data file format description is open and described in the Bathyswath File Formats document. In addition, source code fragments, example programs and technical advice are provided to developers and users who wish to exploit the Bathyswath data in their own software tools. 3.6.6 Sidescan amplitude data Sidescan sonar data is stored in the Bathyswath raw data before any normalisation or time-varying gain (TVG) is applied. The sonar raw data includes the full time series of amplitudes and phases from each ping at a user selectable sample rate. All the data is recorded for each shot (i.e. everything from the trigger to the end of the swath) to allow for full reprocessing of the data. The system applies software normalisation (TVG) to the data and displays the results (as well as recording the raw data) in real-time, and the sidescan can be replayed and reprocessed during postprocessing. This feature, together with the angular measurements and auxiliary sensor data, allows the full sonar equation to be solved, thus permitting the acoustic properties of the seabed to be analysed for research and mapping purposes. 3.7 Other Software Systems The community of Bathyswath sonar users encompasses a very wide range of operational requirements. Although the Bathyswath software provides a rich set of functions, it naturally cannot exactly match the needs of every one of these users. Therefore, the software has provided links to many of the industry-standard software packages available today. The following list gives some of the systems that have been used with Bathyswath sonars. The list of systems that are supported is growing. Many systems not on this list will also read in one or more of the standard file formats that the software provides. Software Vendor Notes ARC ESRI GIS (Geographic Information System) AutoCAD Autodesk Producing CAD-type plots. Integrate other survey data, such as coastlines obtained from land surveys. Issue 4.2 July 2013 Page 3-12 Bathyswath Getting Started Section 3 General Description Software Vendor Notes CARIS HIPS & SIPS CARIS Inc A widely respected hydrographic processing package. Cfloor Cfloor AS A long-standing bathymetry processing system. Fledermaus IVS Inc. A respected processing tool, with excellent visualisation capabilities GeoSurvey CodaOctopus Ltd Sidescan processing and mosaicing software HH suite Helical Bathymetry processing package HydroPro Trimble Navigation and survey planning/ survey processing/ charting package. Hypack Coastal Oceanographics Navigation and survey planning/ survey processing/ charting package. InfoX Via GEMS International Sidescan sonar processing package PDS2000 Reson Navigation, positioning and surveying package; realtime data processing and visualisation QINSy QPS BV Navigation, positioning and surveying package; realtime data processing and visualisation, system control QTC Sideview Quester Tangent Sidescan sonar processing package Quick Grid Perspective Edge A freeware gridding utility program with high-speed data handling ability. SeeTrack SeeByte Ltd AUV mission planning and data processing tool SonarWiz Chesapeake Technologies Sidescan processing and mosaicing software Surfer Golden Software Inc A low cost utility with many very good display abilities. 3.7.1 Using other software systems in real time Bathyswath can be used with ‘fully-functioned’ third-party sonar processing and control systems, allowing the user to perform all data acquisition and processing functions in the third-party system. In this mode, the Bathyswath Swath processor application acts as the interface to the Bathyswath hardware, and performs some initial processing and filtering before sending the data to the thirdparty process. The data that results from this process is as raw as possible whilst maintaining a consistent range-and-angle data format. This format is known as the ‘Parsed Data’ format. The user can elect to use the Swath processor with minimal processing and displays, just passing the Parsed data to the third-party system or alongside the third-party system, with all displays enabled. The Swath processor and third-party application can be run on the same computer, or on different computers, connected by Ethernet. If the Swath processor is run with all its displays and processing enabled, then it may be necessary to use separate computers if the computer used has insufficient processing power and memory. Issue 4.2 July 2013 Page 3-13 Bathyswath Getting Started Section 3 General Description Data Store parsed data (sxi file) Bathyswath Parsed Data Swath Command Plots and Reports Other mapping tool s raw data (sxr file) Displays Displays Optional Figure 3-10 Software Block Diagram with Third-Party Software 3.7.2 XTF sidescan data Bathyswath produces sidescan (amplitude and range) imaging data that is at least as good as many sidescan-only sonars. This data can be exported to third-party sidescan imaging and processing systems using the industry-standard XTF format. 3.7.3 Navigation software Bathyswath software provides a coverage chart, showing which areas have been covered in the survey. A simple survey-planning tool is provided, and the planned survey lines are displayed on the coverage chart, so that the helmsman can steer to them. More sophisticated line-planning and helmsman’s displays are provided by third-party software, which can be integrated with the Bathyswath system. 3.7.4 Software licensing The standard Bathyswath software, that is, Swath and Gridproc, are supplied with a licence to run on the real-time computer used for surveying, and also on a single office-based PC, for postprocessing. More software licences can be obtained by agreement with Bathyswath. Licences for third-party software can be obtained either direct from the suppliers of such software, via Bathyswath, or one of its agents. Issue 4.2 July 2013 Page 3-14 Bathyswath Getting Started Section 4 System Capabilities 4 System Capabilities This section describes the performance and capabilities of the Bathyswath in various survey situations. Additional practical information on surveying is provided in the Online User Guide. 4.1 Sonar Range Line spacing is the distance between adjacent survey lines. The spacing is determined by the sonar horizontal range expected at that depth, and the amount of overlap required. The horizontal range expected depends on the water depth under the sonar-head, as well as the seabed type and the sea state. The term ‘Horizontal range’ is used to describe the sonar coverage from transducers to one side of the swath. The total swath width, from port edge to starboard edge, is therefore twice this range. The horizontal range is limited by two factors: grazing-angle and spreading loss. The grazing angle limit is related to the angle that the sound ‘beam’ makes with the seabed. Directly under the transducers, sound is reflected directly, and there is little loss when sound is scattered by the seabed. Moving away from the transducers, much of the sound is reflected away from the transducers, but enough sound is scattered back for the seabed to be properly detected. At the grazing-angle limit, the sound makes a very small angle with the seabed. Most of the sound is reflected away, and the signal scattered back from the seabed is too small to be detected. 1 7 This effect is dominant in shallow water. The limit is typically reached when the horizontal range is about 7.5 times the water depth. This gives a total swath width of 15 times water depth. In poor seabed conditions, this ratio is reduced to about 5:1. Bottom types such as soft mud or peat can reduce the expected range by as much as 30%. Sand, rock and shingle all give good sonar back-scattering. In shallow water, less than about 10 metres, the ratio rises towards 10:1. The spreading loss limit is simply caused by the sound spreading outwards, and being absorbed by seawater. The rate of absorption is related to the frequency of the sonar signal. The spreading loss limit is thus determined by the distance from the transducers to the farthest point on the seabed (the slant range), rather than horizontal range. This limit is typically 500 metres for 117 kHz, 200 metres for 234 kHz and 100 metres for 468kHz. This is reduced in poor conditions, to about 200, 100 and 50 metres respectively. The corresponding horizontal range is calculated using Pythagoras’ Theorem. The range achieved in a given location is the smaller of the two effects: grazing angle limit and spreading limit. These are summarised below: Issue 4.2 July 2013 Page 4-1 Bathyswath Getting Started Section 4 System Capabilities Effect 468 kHz 234 kHz 117 kHz Grazing angle limit (typical) 1:7.5 1:7.5 1:7.5 Spreading limit (typical) 100m 200m 500m Grazing angle limit (poor conditions) 1:5 1:5 1:5 Spreading limit (poor conditions) 50m 100m 200m The range approximations above apply to depth data. Sidescan is generally visible at greater ranges, about 20% - 50% more than the depth data. Typical range and depth results are illustrated below in Figure 4-1. Figure 4-2 shows the same data in less than 20m water depth. Horizontal Range / metres -350 -300 -250 -200 -150 -100 -50 0 50 100 150 200 250 300 350 0 Water Depth / metres 50 100 SWATHplus-H 150 200 SWATHplus-M 250 300 SWATHplus-L 350 Water Depth / metres Figure 4-1 Horizontal ranges for the three sonar versions, against water depth. The swath width, and so the distance between survey lines, is double the horizontal range shown. -200 -150 -100 Horizontal Range / metres -50 0 50 100 150 200 0 5 10 Bathyswath-L 15 Bathyswath -M 20 Bathyswath -H Figure 4-2 Horizontal Range vs. Water Depth, First 20 metres depth Issue 4.2 July 2013 Page 4-2 Bathyswath Getting Started Section 4 System Capabilities 4.2 Accuracy Consideration must also be given to the accuracy required from the survey. The Bathyswath is essentially an angle-measuring instrument, so that depth accuracy reduces with horizontal range. The angular accuracy of both the Bathyswath sonar and its attitude sensor is better than 0.05 degrees. The accuracy of the combined system is thus better than 0.1 degrees. The maximum range required for a given depth accuracy can easily be calculated. One accuracy specification is that of the International Hydrographic Organisation (IHO), which requires 1% of depth for depths greater than 30m. Depths shallower than 30m should be accurate to 0.3 m. Dredging surveys typically require a depth accuracy of 0.1 metres. An accuracy model for Bathyswath has been developed, validated using real survey data. Figure 4-3 shows the range at which IHO S44 Special Order is just met, against water depth. Figure 4-4 shows the same curves for Order 1A. For example, suppose a 234 kHz system is being used for an Order 1A survey, in 50m water depth. Figure 4-4 shows that the maximum horizontal range for this survey should be about 130m, so a survey line separation no more than 260m. This separation should be further reduced to allow for line overlaps, line-keeping errors, and motion sensor and position uncertainty. Figure 4-3 Horizontal range at which IHO S44 Special order is met. Shapes are measured data Issue 4.2 July 2013 Page 4-3 Bathyswath Getting Started Section 4 System Capabilities Figure 4-4 Horizontal range at which IHO S44 Order 1a is met. Shapes are measured data Any far-range, lower-quality data is trimmed out during post-processing. Remember that the accuracy of the survey will be no better than that of the positioning system and tide measurements. 4.3 Line Spacing The spacing between survey lines is determined by a combination of range limit and accuracy required. There must also be some overlap allowed to account for variations in the survey line followed. Otherwise, any small helmsman’s errors will cause gaps in coverage of the seabed. Allow about 20% to 30% for this. In summary, to calculate the line spacing required for a survey, follow these steps: 1. Calculate the range at the grazing-angle limit. Allow a worst-case factor of five times the depth of water. 2. Calculate the spreading-loss limit. Use a slant range of 100m for 468kHz, 200m for 234kHz and 500m for 117kHz, but reduce in poor or unknown conditions. Calculate the equivalent 2 2 horizontal range, using H = (R - D ). 3. Calculate the maximum range at which you will obtain your required accuracy: see Figure 4-3 and Figure 4-4 above. 4. Select the smallest of the horizontal range limits calculated in steps 1, 2 and 3. 5. Reduce this by at least 20% to allow for overlaps. 6. Double this horizontal range, to calculate the line spacing. 7. Swath width is the same as line spacing. 4.4 Pulse Repetition Frequency The time taken for a ping cycle is that for a round trip from the transducers, to the farthest range, and back again. The speed of sound in water is about 1500 metres per second. Therefore, the time for a ping is given by: t=Rx2/v where Issue 4.2 July 2013 Page 4-4 Bathyswath Getting Started Section 4 System Capabilities t is the time in seconds R is the slant range v is the speed of sound For example, a 150 metre ping takes 0.2 seconds. This gives a pulse (or ping) repetition frequency (PRF) of 1 / 0.2 = 5 per second (or Hertz). If the range for a particular survey is to be held at a particular limit, it is good practice to maximise the PRF for this range. The software allows this range to be set in metres. The corresponding PRF is calculated in software and used in data acquisition. 4.5 Vessel Speed and Along-track Coverage The distance between pings along the track of the vessel is determined by the pulse repetition frequency (PRF) and vessel speed. The system can be set to ping simultaneously on both sides, or in order to minimise cross talk between the two sides, the system can be set to alternate its sonar transmissions, port and starboard. In alternating mode, the along track distance is doubled: d = V x PRF (simultaneous mode) d = 2 x V x PRF (alternating mode) where d is along-track distance between pings, in metres V is vessel speed in metres per second. (Halving the speed in knots gives a good estimate) PRF is the pulse repetition frequency, in seconds. Coverage is also determined by the width of the sonar beam. A narrower beam gives better resolution, but carries a greater risk of missing targets between beams. The 234kHz and 468kHz transducers have a beam-width of 1.1°, and the 117 kHz transducer is 1.7°. At 50 metres, the 234kHz and 468kHz beams cover 0.87m, and the 117kHz beam covers 1.48m. Increasing the speed over the ground will reduce survey time, but will also reduce the along-track coverage. Four to six knots is generally a good compromise. At 5 knots, and 5 pings per second, each side is covered once a metre. At 10 knots, this spacing doubles. If extended ranges are required, the ping rate must be reduced to 2.5 per second, which further reduces along-track coverage. Large amplitudes of yaw and pitch also reduce coverage, by causing pings to bunch up in some places, and become sparser in others. When using the system in simultaneous pinging mode, on a typically flat seabed, the directionality of the two transducers is sufficient to prevent the signals from one side appearing on the other. However, if one side contains a very strong reflector (e.g. a harbour wall), or is very weak (e.g. contains acoustic shadows), then there can be ‘cross-talk’ between the sides. The operator needs to be aware of the risks and priorities. Typically, it may be safest to use alternating mode where bathymetric accuracy is paramount, and simultaneous mode when using the system to detect small objects on the seabed. When high coverage is required in a limited area, and channel cross-talk is a problem, it may be beneficial to ping on one side only, thus doubling the along-track coverage on that side. 4.6 Media Usage The Bathyswath samples a high density of data. It therefore stores data to disk at a high rate. When recording a full set of bathymetry and amplitude points, the recording medium is typically filled up at a rate of 150Kbytes per second. High-resolution surveys will fill the disk faster than this. The Swath program gives an indication of the data recording rate at the current sonar settings. 150Kb per second is 0.54Gb per hour. Data should be archived from hard disk to a backup location, at regular intervals, ideally every day. Issue 4.2 July 2013 Page 4-5 Bathyswath Getting Started Section 4 System Capabilities USB external disk drives are a good way to store and transfer Bathyswath data. A 1Tbyte drive can store 11 weeks’ continuous recording. If the data-recording rate is a problem, the user may select a lower data-sampling rate. This will save recording media, but at the expense of resolution. The expected data recording rate for the current data sampling rate is shown in the Sonar dialog in the Swath program. 4.7 Interferometry A ‘swath-sounding’ sonar system is one that is used to measure the depth in a line extending outwards from the sonar transducer. Such systems are generally arranged so that the line of depths, or ‘profile’, lies at right angles to the direction of motion of the transducer platform. As the platform moves forwards, these profiles sweep out a ribbon-shaped surface of depth measurement, known as a swath. The term ‘interferometry’ is generally used to describe swath-sounding sonar techniques that use the phase content of the sonar signal to measure the angle of a wave front returned from a sonar target. This technique may be contrasted with the ‘beamforming’ set of sonars. These generate a set of receive beams, and look for an amplitude peak on each beam in order to detect the sea-bed (or other targets) across the swath. Bathyswath measures the phase of the measured signal at each of the transducer staves relative to a reference signal at the system’s sonar frequency. The phase difference between the staves is derived by subtracting these phase measurements from each other. The phase is derived from a simple and robust electronic method, which directly provides a digital measurement of phase. The electronics are thus kept simple and therefore small and reliable. Wavefront angle is calculated from a simple formula relating phase and transducer spacing measured in wavelengths. In order to measure the angle accurately, more than one pair of staves must be used. Narrow spacings give an unambiguous measurement of angle, but are more susceptible to noise and give poor resolution. Wide spacings give good resolution and noise immunity, but any one-phase measurement from them can decode to several elevation angles. To overcome these restrictions Bathyswath uses a range of spacings to obtain the best results. The combinations of spacings are used in a manner similar to that used by a mechanical vernier measuring device. Figure 4-5 illustrates this process. Figure 4-5 Principle of interferometric sonar Additional information on interferometry is provided in the Online User Guide, accessed from swath's Help menu. Issue 4.2 July 2013 Page 4-6 Bathyswath Getting Started Section 5 Hardware Installation & Deployment 5 Hardware Installation and Deployment Bathyswath has been designed to be utilised on a variety of inshore survey craft. The systems are capable of being deployed permanently on dedicated survey vessels, or vessels of opportunity, such as fishing vessels and harbour master’s launches. There are several distinct methods of mounting the transducers and the attitude sensor: Hull mounted transducers, remote attitude sensor (see sub section 5.13) Bow mounted pole mount, attitude sensor alongside transducers (see sub-section 5.14) Over-the-side pole mount, attitude sensor alongside transducers (see sub-section 5.15) Buoy mount (see sub-section 5.16) In all cases, the Bathyswath electronics and the computer are installed within the survey vessel’s hull and super-structure. Bathyswath can also be installed on remote vehicles, such as remotely operated vehicles (ROVs), unmanned or autonomous underwater vehicles (UUVs or AUVs) and autonomous surface vehicles (ASVs). Installation on such vehicles usually requires interfacing and installation design specific to each vehicle. Bathyswath can provide detailed advice on request. 5.1 Equipment List 5.1.1 Bathyswath parts list, main assemblies Part Qty Sonar transducer array, 468 kHz, or Sonar transducer array, 234 kHz, or Sonar transducer array, 117 kHz 2 or 3 2 or 3 2 or 3 Mounted in Transducer Interface Unit (TIU) contains 2 or 3 Transducer Electronics Modules (TEMs); this may be the ‘standard’ TIU, or the splash-proof unit provided with BathyswathSPLASH 1 Software, Swath Processor, Grid Processor 1 5.1.2 Additional (and optional) equipment required for operational use Part Qty Attitude and position information system Issue 4.2 July 2013 1 Page 5-1 Bathyswath Getting Started Section 5 Hardware Installation & Deployment Computer Workstation (PC) 1 Pole-mount transducer V-bracket, 468 kHz, or 1 Pole-mount transducer V-bracket, 234 kHz, or 1 Pole-mount transducer V-bracket, 117 kHz, or 1 Variable-angle transducer V-bracket 1 Pole-mount pole assembly 1 Bow-mount assembly, comprising: 1 Bow-mount ‘ears’ 2 Tensioning straps 4 5.1.3 Variable-angle transducer chassis The standard transducer V-brackets are set up with a fixed transducer elevation angle of 30. This has been found to be a good compromise for most survey work. However, for depths close to, or even exceeding, the stated depth capability of a particular sonar frequency, a transducer angle of 40 to 45 will give better results. A variable-angle transducer V-bracket can be supplied for this purpose. 5.2 System Details See section11 for the dimensions, power consumption and other parameters of Bathyswath system components. Issue 4.2 July 2013 Page 5-2 Bathyswath Getting Started Section 5 Hardware Installation & Deployment 5.2.1 Cabling required for a typical two-transducer installation Cable name From To Type Number of conductors Diameter /mm Transducer Port Port Transducer Transducer Electronics Module Screened Twisted Pair 7 screened pairs 13.7 Transducer Starboard Starboard Transducer Transducer Electronics Module Screened Twisted Pair 7 screened pairs 13.7 TEM interface TEM PC USB Screened pairs 4 Attitude Sensor Serial (PC) Comms. Interface Box PC Screened Twisted Pair 3 screened pairs 10 Compass Serial (PC) Comms. Interface Box PC Screened Twisted Pair 3 screened pairs 10 Position Serial Input Position System PC Screened Twisted Pair 3 screened pairs 10 Alternative attitude & position, Ethernet Attitude & position system PC Ethernet Screened pairs 5 PPS Input Position System TIU BNC coax 2 6 PC Power Mains or DC supply PC Mains cable or DC power cable 3 10 TIU Power Mains or DC supply TEM Housing Mains cable or DC power cable 3 10 Notes: All dimensions and weights are approximate. 5.3 Power Requirements Bathyswath TIU Parameter Supply Voltage Value 110 -230Vac (50/60Hz) 12 – 25Vdc Supply Current AC 0.5A typical Supply Current DC 2.5A at 12V max 1.5A at 24V max Power Supply Fuse Issue 4.2 3A 250V slow-blow type July 2013 Page 5-3 Bathyswath Getting Started Section 5 Hardware Installation & Deployment Bathyswath requires clean electrical power of 12-25V DC, approx 200W, including the power needed for the PC and for auxiliary systems, such as attitude and position. The system is supplied with a mains-to-DC converter, so that it can also be run from 110-240V AC mains. Bathyswath-SPLASH takes a nominal 24V supply; 20 – 29V. When using mains power, the use of an Uninterruptible Power Supply (UPS), or Line Volt Conditioner (LVC) is may be necessary, in order to ensure a clean and continuous supply. In situations where the survey vessel is unable to supply the required power, a generator should be used. The use of a small generator may also require the use of an UPS or LVC. Inverters can also be used to provide mains power from batteries. These sometimes give a very noisy output, so it is advisable to use high-quality units. Small generators are available that provide 12V DC or 24 V as well as mains AC power, and are acoustically quiet. These units can be very useful on small vessels. Refer to section 0 for information on grounding and earthing power supplies. 5.3.1 Supplying Power from Batteries The Bathyswath Transducer Interface Unit (TIU) DC power version is suitable for receiving power from a 12V battery, or two such batteries in series. Equipment that requires mains can be supplied from an inverter. However, it is preferable, and safer, to use DC-powered equipment on small boats where possible. For example, when using a laptop computer, use a DC power supply in preference to the mains supply unit that came with the laptop. Such DC power units are sold for use in motor vehicles. Use two batteries in series for Bathyswath-SPLASH, or the optional battery unit that may be supplied with the system. Some systems require both 12V and 24V. See Figure 5-1 for a recommended layout. Warning When supplying power from two batteries in series, in systems where both 24V and 12V are needed, all units that require 12V must be powered from the “lower” of the two batteries (the one that is not supplying the 24V output). Otherwise, the voltage of one of the batteries could be connected directly through the ground or negative power lines, causing serious equipment failure and a risk of over-heating and fire. It is good practice to establish a single ground point for mains ground and DC power negative rails. See section 0. Issue 4.2 July 2013 Page 5-4 Bathyswath Getting Started Section 5 Hardware Installation & Deployment 24 V systems 12V Battery Laptop PC mains Inverter Laptop PSU USB 12V Battery Common ground point DC power in Bathyswath TIU Sea earth Ship ground Other DC grounds (e.g. GPS) Figure 5-1 Recommended 12V-24V Power Connection 5.4 Switching Mains Input Voltage Bathyswath can be supplied to support operation with 110V -230V AC mains. The supplied components and auxiliary subsystems must be checked to ensure that they are set for the supplied voltage. The power requirements must be carefully checked before applying power, otherwise severe damage to equipment could occur. 5.5 PC Installation Bathyswath operates with a Windows compatible PC. The PC provides the operator interface and controls. See Section 7.1.1 for the recommended PC specification and information on installing the software. Laptop computers can be used. The PC layout may vary, depending on the model used. The essential connections are: Monitor cable: computer monitor connector to monitor Keyboard cable: computer keyboard connector to keyboard Mouse cable: computer mouse connector to mouse. Power connections to the PC and monitor, using three-pin IEC connectors or DC power inputs. Bathyswath-SPLASH is provided with an integral PC computer, running Windows XP Embedded. The Bathyswath software and TEM drivers are provided installed on this computer. 5.6 Workstation Peripheral Devices Installation The SWATHplus software allows for the use of a range of peripheral devices. These include: Peripheral Interface Expansion Disk drive External USB or internal Extra storage space when processing CD/DVD drive External USB or internal Data archiving and exchanging data and software Plotter USB Hard-copy from the processing software Issue 4.2 July 2013 Use Page 5-5 Bathyswath Getting Started Section 5 Hardware Installation & Deployment 5.6.1 Data archiving A large hard disk can contain many days’ survey data (see section 4.6). However, any disk fills eventually, and so the data needs to be stored for archive. External USB disks, sold for backing-up computer data, can be very useful for this purpose. 5.6.2 Serial interface This is a standard RS232 interface. It is used to communicate with auxiliary sub-systems such as the attitude sensor, compass and positioning system. Most modern PCs areno longer fitted with serial interfaces, so a way of connecting serial ports to the PC is needed. Ethernet-to-serial converter units have been used successfully for this, for example those made by ‘Moxa’. Some serial interface devices can cause large and un-defined time delays to the input data stream; these should be avoided. One useful tip is to disable any internal data buffering in the device. There are two connector types commonly used for RS232. These are 9-pin D-type and 25-pin Dtype. The 9-pin types are far more common for interconnection between marine systems, and so these are the preferred type. If the sonar system is to be used on a range of installations and vessels, it is a good idea to obtain a stock of serial converter connectors and cables. These provide ‘null-modem’ swaps (swapping over transmit and receive), gender swaps (from pins to sockets and vice-versa), and pin-number swaps (9 to 25). The pin use on the PC 9-way D-type connectors is as follows. This same arrangement is used on most peripheral devices. In order to connect between these ports, a ‘null modem’ cable is required. This connects pin 2 on one connector to 3 on the other, and vice-versa. Pin 5 is carried straight through. Pin Use 2 Receive (into the device) 3 Transmit (out of the device) 5 Ground Some auxiliary systems, such as attitude sensors and positioning systems, only output data, and do not require an input. Therefore, only pins 2 and 5 are used. However, some such systems are configured by a program that is run on the PC, so the output line is also used. The connectors on the PC and auxiliary devices are usually male, that is they have pins rather than sockets. If more than one system requires data from an auxiliary system, the output can be spliced to both units, but only on the transmit line from the auxiliary system. Do not splice to inputs into the auxiliary device, otherwise the equipment could be damaged. The use of opto-isolated inputs, either as a feature of the interface card, or as an in-line module, is recommended in order to minimise noise and damage from over-voltage conditions. 5.6.3 Attitude system Ethernet interface Some attitude and position systems provide data over an Ethernet interface. See section 5.10.6 for details of configuring this interface. 5.6.4 Switching on Turn the monitor on; switch may be on back or front. Switch on any peripheral devices. Switch the power switch of the computer to on. The PC should now ‘boot up’. See Section 5 ‘Software Installation’ for installing and starting the Swath software. Issue 4.2 July 2013 Page 5-6 Bathyswath Getting Started Section 5 Hardware Installation & Deployment 5.7 SWATHplus ISA Interface Card Versions of the “SWATHplus” TEMs supplied before autumn 2006 use an interface card that plugs into the computer’s ISA bus. This has now been replaced by USB interfaces in the TEMs. See the installation instructions supplied with the software and hardware for the details of installing a SWATHplus ISA card. 5.8 Bathyswath Transducer Interface Unit (TIU) Installation The Transducer Electronics Modules (TEMs) are supplied installed in a box called the Transducer Interface Unit (TIU). This has a separate DC or mains supply. The TEM USB connectors are brought out the rear of the unit using cables inside the housing. 5.8.1 USB Connection If the USB connection is made direct from the TIU to the PC, the USB cable needs to be kept short in order to provide reliable communications. If the TIU must be mounted at a distance from the PC, consider the use of a COTS USB extender system, such as a USB-to-Ethernet converter. 5.8.2 Transducer Connections The transducer connections are made with rugged, polyurethane, marine-grade cable. These are rather stiff, and care must be taken in planning the route that these cables take to reach the TEMs. Otherwise, the cables may tend to lie in a location that obstructs the operator's access to the PC or other systems. The connector is about 120 mm long. Allow a bend radius of about 50 mm. Connect the transducer connectors to the connections on the front of the TEMs. The selection of the TEMs in terms of port or starboard transducer is made in the Swath software Sonar set-up dialog. Conventionally, the top TEM is connected to the port transducer. It is advisable to mark the transducer connectors with red and green tape to identify which one is which. 5.8.3 Power Connections Connect the power to the power inlet port on the TEM housing. The TIU takes DC power, 9 to 32 V, and it is supplied with a mains-to-DC converter unit. DC power can be provided from a ship's power system or from a separate battery. The TIU works with one or two 12 V lead-acid batteries. If working with mains power, connect the mains-to-DC converter to the mains supply and the output lead to the TIU. 5.9 Grounding and Earthing Proper earthing and grounding of the system is very important for two essential reasons: Protecting personnel from the effects of mains faults. Limiting the effects of electrical noise on the sonar signal. It also reduces the risk of accidentally connecting a power source across a ground connection: see section 5.3.1. 5.9.1 Mains safety earth For personnel safety, the mains power supply earth (if used: some systems are supplied with DC power) must be connected right through the system. Ensure that the earth connection to all the units that take mains power is effective. If in doubt, consult the person responsible for the vessel’s electrical supply. 5.9.2 Noise reduction Ships can be very electrically noisy. This noise can be picked up by the Bathyswath and degrade the depth measurements. Correct earthing can significantly reduce this noise. The earthing Issue 4.2 July 2013 Page 5-7 Bathyswath Getting Started Section 5 Hardware Installation & Deployment arrangement that gives the best results on any vessel can only be found by experiment. This is because each vessel has different noise characteristics and earthing arrangements. This part of setting up a Bathyswath system is very important, and should not be skipped or rushed. High external noise is a common cause of poor survey results. The TEM Signal Ground is brought out to a connector on the back of each TEM. The ground is also bonded to the metalwork of the housings. One significant source of noise is the difference in potential between the sea and the electronics. This potential can be induced by electromagnetic noise. Connecting the Signal Ground to a good sea-earth can reduce this effect. This can be done by: On pole-mounted systems, run a wire between the TEM Signal Ground connector and the metalwork of the pole. Use a wire with a good cross-section, and ensure that the connection to the pole is robust. Keep seawater out of the copper cores of the wire, as corroded wires make very poor contact. Inspect the cable at regular intervals when in use, and replace it if the cores become very dull in colour or show other signs of corrosion. On hull-mounted systems, connect the Signal Ground to the vessel’s sea-earth. Establish a star network (where all grounds connect to a single point) or a distributed star (a set of stars connected together), and avoid earth loops. This is not always simple, as there may be earth connections between the components of the system that are not obvious. This is illustrated in Figure 5-2 below. Star point TEM ro al g n Sig Sign al grou gr ou nd TEM Beware of earth loops caused by pre-existing ground connections PSU und pole nd GPS Attitude sensor Ship's hull (if metal) transducers Figure 5-2 Schematic diagram of a typical earthing arrangement Make a drawing of the cables and connections of the system as it is installed on the boat, including auxiliary systems and power supplies. Not only will this help in detecting problems, but also it will be useful for re-installing the system if it needs to be removed for storage or use on another vessel. It is not necessary to connect the earths of the two TEMs together if they are installed in the same housing, as their grounds are also connected together via the chassis. Do not coil up un-used parts of the earth wire: cut it to length. Coils can cause the earth wire to pick up external electrical interference. For the same reason, do not run the earth wire close to mains wires or the active signal wires from other electrical systems. If noise is still a problem, try connecting Signal Ground to mains earth. However, before attempting this, ensure that mains earth is effective and safe (see above). To evaluate the amount of noise pick-up, start the Bathyswath system running as in normal survey mode, but with the transmit signal turned off. Make sure that the transducers are plugged in to the TEMs, and are in the water, and that all auxiliary systems (attitude, position, etc.) are operating and plugged in to the Bathyswath system. However, if one or more of these systems are not available Issue 4.2 July 2013 Page 5-8 Bathyswath Getting Started Section 5 Hardware Installation & Deployment at the time of the test, use the ‘Test Mode’ option under ‘Configuration’ in the Swath program. Disable all of the angle and phase filters. Look at the ‘Cross Profile’ window. If noise is low, then this display will show a random ‘cloud’ of noise points. If there is significant noise pick-up, then the display will show a straight line issuing from each transducer. Depth measurement is severely compromised when these straight lines continue to exist when the transmit signal is enabled and the system is measuring a seabed. Open an ‘Amplitude’ window. The vertical scale is signal amplitude, and the horizontal scale is range. The TEM output is logarithmic, so one division at the bottom of the window represents much less of a step in signal than one division at the top. With the transmit signal disabled, the noise level should be below the second division of the screen, less than 10,000 for the arbitrary 16-bit numerical scale, and as low as possible. If it is above this, effort should be taken to reduce it, and if it is approaching the middle of the scale (30,000), system performance will be very severely degraded. It is not advisable to proceed to survey with this level of noise still present. The target level can be established by replacing the transducer plug with one that shorts out the signal inputs. Note that the signal level rises considerably if nothing is connected to the TEM’s transducer connector at all; this is normal, and so noise reduction investigations must be done with the transducers plugged in and in the water. Examine the amplitude display for repeating ‘waves’ or ‘spikes’ of signal noise. These may be caused by electrical or acoustic interference from other systems, or they may come from the power supply used. These should be identified and eliminated. Try turning off or disconnecting other systems on the boat, to see if the noise signal changes. If noise pick-up persists: Try other combinations of earthing. Some earth connections will make things worse, by introducing ground loops where two items are already grounded together by another route. Ensure that the transducer cables do not run around or next to any other cables, especially mains, Ethernet, and auxiliary sub-systems (position, attitude, etc.). Look for external sources of interference. Radio and radar transmissions can be particularly troublesome, as they operate at similar frequencies to the Bathyswath sonar. Try changing the physical location of the components of the system. Disconnect the auxiliary inputs to the system to see if the noise level falls. It will be necessary to set the corresponding ‘attitude derivation’ or ‘position derivation’ to ‘Use Fixed Value’ in the dialogs under the Configuration menu in the Swath program, in order to maintain a visible output in the Amplitude window. This is achieved in one step using the ‘Test Mode’ command under ‘Configuration’. (Tip: save a session file with the ‘Use Fixed Value’ settings; call it ‘TEM_test.sxs’ or similar). Once a particularly noisy auxiliary item has been identified, it can be targeted for careful earthing. One cause of noise is a sensor that is poorly earthed internally or in its own sub-system. If this cannot be rectified, consider the use of an opto-isolator in the serial line from the auxiliary system. These can be obtained from must suppliers of industrial computing equipment. Ensure that connections to metalwork are electrically and mechanically robust. For example, aluminium forms a layer of oxide that is an excellent electrical insulator. It is usually necessary to use a self-tapping screw or similar to obtain a good earth. If the ship has a metal structure, then consider setting up an earth bolt, firmly electrically and mechanically bonded to the metal. This can form the ‘star point’ of the earthing system. If some instruments are powered from a separate 12V or 24V DC system, try running an earth to the negative rail. Try changing the power supply: for example, some mains inverters give out a very ‘spiky’ waveform, which can appear very strongly in the sonar signal. If the PSU cannot be changed, try using a line voltage conditioner unit. 5.10 Installing Position, Heading and Attitude Subsystems 5.10.1 Attitude sensor When mounting the transducers in the hull: Issue 4.2 Mount the attitude sensor as close to the transducers as possible. July 2013 Page 5-9 Bathyswath Getting Started Section 5 Hardware Installation & Deployment Mount the attitude sensor on the fore-and-aft centre line of the vessel. Align the attitude sensor's vertical axis with the vertical that applies when the vessel is afloat. Strive to make the above alignments as exact as is practical. It should however, be noted that slight misalignments of 1 or 2 degrees can be compensated for in the patch-test calibration of the system. Ensure that the attitude sensor's mount is completely rigid. The attitude sensor measures the angular location of the transducers to better than 0.05°. It must therefore not move relative to the transducers by more than this, when the vessel rolls and pitches. Prepare a mounting bracket for the attitude sensor, that: is rigidly fixed to the structure of the vessel, cannot move relative to the transducers, does not need to be disturbed for any reason, and is not in a walkway. Some attitude sensors are taller than they are wide. When mounting these units, consider using a frame that holds the top of the unit to prevent it swaying relative to the vessel. When pole-mounting: If possible, use a version of the attitude sensor that is supplied in a pressure-tight bottle, and fix it next to the transducers. Otherwise, the attitude sensor will not be able to correct for the motion of the end of the pole relative to the sensor. Use the attitude sensor mounting bracket supplied by Bathyswath, appropriate to the unit being used. In general: Refer to the attitude sensor’s own handbook for installation instructions that are specific to the particular model used. Most attitude sensors are supplied with set-up software that runs on the PC computer. Run this software before using the sensor to survey. Most sensors need some kind of calibration process before they give an accurate output. This might typically consist of a settling period, followed by a series of turns or pre-define manoeuvres. Consult the sensor’s own manual for details. Ensure that the attitude sensor is mounted the correct way up, facing in the correct direction. Refer to the attitude sensor's manual for further details. Many models can be configured to work in different orientations. Make sure that the orientation is entered correctly into the motion sensor’s set-up software. Accurately measure the location of the attitude sensor in three dimensions, relative to both the sonar transducers and the positioning system. It is necessary to account for the difference in position between the attitude system, position antenna and sonar transducers. This is called a ‘lever arm’ correction. In preference, use the attitude sensor’s internal lever-arm correction facilities, rather than the lever arm corrections in the Swath software. This is because the attitude system has more information at its disposal than the Swath system, and hence should be able to make a better correction. Make sure that the lever arm correction is not made in both systems. That is, if the attitude system can perform the lever arm correction and output attitude and position valid for the location of the sonar transducers, set the position offsets in the Swath system to zero. See the Online User Guide topics on Calibration for further information on measuring and configuring the attitude sensor offsets. 5.10.2 Compass A compass provides heading information. Issue 4.2 July 2013 Page 5-10 Bathyswath Getting Started Section 5 Hardware Installation & Deployment Most gyrocompasses can be interfaced to Bathyswath. For smaller installations, a magnetic fluxgate compass can be used, but this is less accurate and more prone to disturbance from external metallic objects, including the ship itself. Some attitude systems provide heading directly, either from a built-in compass, or because their gyros are accurate enough to detect the rate and axis of the Earth turning, and therefore are gyrocompasses in their own right. In this case, a separate compass feed is not required. Alternatively, some heading sensors use a pair of GPS antennae, and measure the angle between them. Bathyswath obtains heading through two main channels. Only one is required for processing, although comparing the two is a useful diagnostic check. The two channels are: A direct connection to the compass; Via the attitude sensor. In some cases, the attitude sensor takes in heading from the compass, combines it with ‘high-frequency’ yaw from its own gyros, and transmits the combined heading value back to Bathyswath. Bathyswath reads the compass information in the standard NMEA format. As specified in the NMEA format, this is an RS232 serial link, typically running at 4800 baud, with 8 bits, no parity. Most attitude sensors also use this format, and some models will read other formats as well. Refer to the sensor’s own manual. Sometimes the compass provides heading information in a format that can be read by the attitude sensor, but not by Bathyswath. In this case, the heading channel that passes through the attitude sensor is used in processing, and the direct link to the Bathyswath is ignored. If a fluxgate compass is used as a heading reference, it should be mounted away from magnetic fields on the vessel (engine, generators and large ferrous objects). The masthead is often the best location. The compass must be installed and aligned in accordance with its own Manual and good survey practice. Heading information can also be obtained from course-made-good, which is the direction between successive positions from the GPS system. However, this is far less accurate than the heading from a compass, and should only be used as a last resort if heading from the compass or attitude system is not available. See the Online User Guide topics on Calibration for further information on measuring heading and configuring heading offsets. 5.10.3 Position The position of the vessel is obtained from a positioning sub-system. The position is usually derived from GPS, although several other types of system exist. The position interface is an RS232 serial port. A range of serial line parameters may be used. Bathyswath may be set-up to accept various settings of baud rate, number of bits, parity and stop bits. See the Online User Guide for how to set-up position inputs. In order to maintain the accuracy of the survey, the positioning system should be accurate to 1 metre or better, with an update rate of 1 second or better. Surveys that require better depth accuracy may require better position accuracy than this. Some positioning systems provide a measurement of height above datum. Bathyswath records this height information and it can use it instead of tide measurements. This feature is often very useful for improving the accuracy of a survey. Be aware of the errors that can arise from differences in grid systems, geoids and datums. Bathyswath accepts position data as grid co-ordinated (easting and northing) or as latitude and longitude. In the latter case, the latitude and longitude are converted to grid positions when they are read into the system, using a range of conversion protocols, including Universal Transverse Mercator (UTM). A range of geoids and other conversion parameters are available in the Position input dialog. Post-processing is carried out using grid co-ordinates. Alternatively, use a proprietary Issue 4.2 July 2013 Page 5-11 Bathyswath Getting Started Section 5 Hardware Installation & Deployment software package to convert the position to grid co-ordinates on-line. Several excellent packages are available for this function; these also provide many useful features for planning and running the survey lines. Some models of attitude sensor can accept information from the position system to help it correct for errors that arise from centripetal acceleration in turns. The position information required by the attitude sensor for this purpose must usually be of a specific NMEA format, but does not need to be as accurate in position as that used for locating the Bathyswath depth measurements. See the attitude sensor’s own manual for further details. 5.10.4 Height The vertical height of the sensors can be obtained in several different ways: Heave from the attitude sensor, combined with tide information. These are essentially high frequency and low frequency components of vertical position. If tide is used, the depth of the transducers below the waterline must also be measured. GPS height: the altitude component of the GPS data. This is usually only accurate enough for surveying purposes if a high-accuracy GPS system is used, for example Real Time Kinematic (RTK). Combining GPS height and heave. As these are both capable of recording relatively high frequency information, the GPS height needs to be filtered before combining. The length of the filter is selectable in the Attitude Derivation dialog. However, it is much better to allow the attitude system to perform this data merging if it has the capability to do so. From a pressure sensor in an underwater vehicle; this can be further combined with heave from the motion sensor if necessary. Tide data is not needed if GPS height can be used. Tide information can be fed in as a real-time data stream into an Auxiliary serial port, if it is so available. 5.10.5 Combined attitude, heading and position systems Some systems provide a combination of two or more of attitude, heading and position. In this case, it may be necessary to make more than one connection from the sensor to the Bathyswath computer. Heading can be derived from the attitude string, but position needs to come in on a separate serial line. In any case, attitude and position are usually supplied in different formats, and need to be decoded differently. The ‘Attitude Derivation’ dialog under the ‘Configuration’ section of the Swath program provides a range of options for deriving roll, pitch, heading and height. 5.10.6 Attitude system Ethernet interface Some attitude and position systems provide data over an Ethernet interface. Ethernet interfaces are generally preferable to serial, because: Latency is less of a problem Modern laptop computers tend to be fitted with Ethernet, but not serial ports The attitude and position systems can provide more data over Ethernet, which helps with decoding. For example, such systems generally provide data packets with time-tags on Ethernet, but not serial. If possible, the attitude Ethernet input should be provided on a dedicated Ethernet line. Heavy traffic on a general-use Ethernet line can slow down the reception of data from the attitude system. At the time of writing, the attitude Ethernet inputs supported by Bathyswath are those from the CodaOctopus F180 and the Applanix POS/MV. The instructions below are those for the F180. Other systems are similar. 1. Set up the attitude system to send data by Ethernet. Typically, this is done from the Attitude system’s PC-based application, using a ‘UDP retransmit’ function. Tip: these attitude sensors Issue 4.2 July 2013 Page 5-12 Bathyswath Getting Started Section 5 Hardware Installation & Deployment are usually supplied with their own set-up program, using the same UDP port as Bathyswath. As it is not possible to configure the same port number to two applications running on the same computer, the attitude sensor’s own application program should be closed down before connecting it to the Swath program. If it is necessary to run the attitude sensor set-up program during the survey, perhaps to monitor the system’s performance, run the sensor’s application on a different computer on the network. 2. Set up the parameters of the UDP output from the attitude sensor or its PC application in the initiation file. 3. Open the Bathyswath initiation (§7.4.1) file in a text editor. This is generally found at: ‘C:\Program Files\Bathyswath\Bathyswath\ swathprocconfig.txt’. 4. Find the section with entries that start ‘F180socket’. This section applies to other Ethernet input systems (such as POS/MV), too. 5. Enable Ethernet attitude input by setting: F180socket enabled 1 6. If required for system timing, configure Swath to use the sensor time to set its own clock, using: F180socket timesyncEnable 1 For most applications, ‘0’ is the recommended setting; see §6 for details. 7. Run the Swath program. 8. Click on ‘Attitude’, then ‘Network Settings’. Enter the port number that the sensor is broadcasting to (generally 3000 for F180 and 5602 for POS/MV). 9. Click ‘OK’, and ‘Connect’ in the Attitude Sensor Settings dialog. 10. If position is being obtained from the same source, open the Position dialog, and select the appropriate input format, e.g. ‘Coda MCOM’ or ‘POS/MV 102’. 11. Refer to §6 for advice on selecting timing from ‘Sensor Clock’ or ‘PC Clock’ 5.10.7 Speed of Sound Sensors Bathyswath can take inputs from speed of sound sensors in two ways: 1. Regular vertical profiles (‘dips’) taken by the operator using a separate, stand-alone instrument. The profiles (measurements of speed of sound against water depth) are entered as tables into the Swath software. 2. Continuous updates from a speed of sound sensor mounted next to the transducer heads. This measurement is used to perform the calculation of the angle of the sound wave at the transducer head. This may be necessary if the survey takes place in an area where the speed of sound at the surface changes significantly, for example, in an estuarine area. The vertical profiles are always necessary where the speed of sound changes with depth. The continuous updates are important where the surface sound speed changes across the area. Frequently, both are needed, but sometimes one or neither of them is adequate for an accurate survey. 5.10.8 Echosounders A single-beam echosounder can be mounted alongside the Bathyswath transducers. The echosounder does not have to be mounted close to the Bathyswath transducers, in order that the attitude system corrections apply, as a position offset can be entered into the Bathyswath software, and thus a ‘lever-arm’ correction made. It is likely that there would be acoustic cross-talk between the systems, and so the transmit pulse trigger output from the Bathyswath TEM (only available on later versions of the TEM) should be connected to the echosounder’s input trigger line, if available. Bathyswath can read echosounder data on an RS232 serial line with formats including: Valeport, NMEA, AML, CSV, SVP16, WESTGEO and HYPACK. Issue 4.2 July 2013 Page 5-13 Bathyswath Getting Started Section 5 Hardware Installation & Deployment 5.11 Wet-end Deployment The term ‘wet-end’ is used to collectively describe all those parts of the Bathyswath system that, when in use, are in contact with the water. Their method of deployment will differ slightly according to circumstances. This manual covers three configurations. These are: hull mounting, bow-mounting and sidemounting. Hull mounting is the best option when the transducers are to be permanently mounted to a vessel. The second two options are best when the system is to be installed for a limited time and are both carried out using the pole-mounting equipment. 5.12 Transducer Installation – General The following points apply to any installation. Also, refer to the instructions specific to the particular configurations below. 5.12.1 Transducer versions Bathyswath currently may use three versions of transducer, operating at 117kHz, 234kHz, or 468kHz. The first two transducer types are usually fitted with a 20 metre cable, the 468kHz usually has a 15m cable. 5.12.2 Transducer location The faces of the transducers must not lie in aerated water. Aeration can occur when fine bubbles are drawn under the hull from the air-to-water interface around the hull, or from the action of propellers or other propulsion mechanisms. The sonar range of the system is severely curtailed when the transducers pass through the wash of a vessel. On no account should the transducers be mounted aft of the propellers. Avoid mounting the transducers aft of obstructions in the hull such as thruster tunnels. The transducers should be mounted in a location where they remain in the water at all normal roll and pitch angles. Measure the location of the transducers in three dimensions relative to the attitude sensor. Measure the location of the transducers in three dimensions relative to the positioning system aerial. Measure the depth of the transducers relative to the water line. These measurements should be made with an accuracy of about 10 mm. See the Online User Guide for more information on measuring sensor positions and orientation definitions. Transducers should be mounted so that: The top of the front face is horizontal; i.e., there is no pitch offset The front face points downwards at 30 degrees to the horizontal. That is, the surface of the front face is at 30 degrees to vertical. One transducer points port and the other starboard, both at 90 degrees to the direction of motion of the vessel. Other configurations are possible, and the software will correct for any transducer orientation. However, the angles described above are optimal for most survey conditions, and the transducers should be set up to within one or two degrees of this. Any slight offsets from these nominal angles can be measured using the post-processing patch test calibration procedure. In some cases, it can be beneficial to adjust the vertical angle of the transducers. If operating in very deep water, close to the depth limit of the frequency option being used, then increasing the transducer angle to 40 or 45 can improve performance. Similarly, if the application is concentrating on scanning objects close to the water level, then pointing the transducers horizontally or even slightly upwards can give better results. Issue 4.2 July 2013 Page 5-14 Bathyswath Getting Started Section 5 Hardware Installation & Deployment 5.12.3 Transducer cabling The signals from the transducers are at very low voltages and at radio-signal frequencies. They are therefore prone to external interference unless care is taken during installation. The cable length between transducer and electronics rack should be less than 20 metres, and less than 15m for Bathyswath-H systems. The transducer cables supplied are shielded twisted pairs. Similar cables should be used if the installer supplies alternative cables to connect the transducers to the rack. 2 Core sizes must be 16/0.2 (0.5 mm ) or greater. Avoid cable routes in close proximity to equipment or cables operating at radio frequencies, or carrying electrical power. Transducers shipped after 2008 are usually fitted with a 1-metre ‘tail’, joined to an extension cable with an underwater cable. This allows different cable lengths to be fitted without needing to modify the transducer. The transducers are activated by a transmission pulse at approximately 450 V rms. This can cause interference with other equipment, and could be a hazard to personnel, unless precautions are taken. 5.12.4 Transducer parameters See section 11.5. 5.13 Hull Mounted Configuration Where the Bathyswath is to be permanently mounted on a dedicated survey vessel, the transducers and attitude sensor will be fixtures on the vessel. 5.13.1 Possible hull configurations Broadly, there are two possibilities: flush-mounting or chock-mounting: 5.13.2 Flush-mounting Mounting the transducers so that the active face of the transducer is flush with the surface of the hull will have the minimum effect on the operation of the vessel. However, this requires that the hull include a section at the correct angle (30° from the vertical), and in a suitable, aeration-free position. This option requires that a hole the size of the transducer must be cut in the hull. Typically, a watertight box section will be fixed into the hull, so that the integrity of the hull does not depend on the presence of the transducer. A watertight tube may be run from the back of the box up to the location of the instruments, which should be above the water level. 5.13.3 Chock-mounting In this option, the transducer stands out from the hull. It is backed by a mounting frame and surrounded by a fairing to ease the flow. In this case, there is a little more resistance to flow, but this is not likely to affect vessel motion. The shape of the chock may cause the flow over the transducer face to be a little more turbulent, but on the other hand, the transducer face will be lifted away from surface effects on the vessel’s hull. This option requires only a small hole to be drilled in the vessel’s hull, to allow the transducer cable to pass through. 5.13.4 Transducers These points are in addition to those listed in ‘Transducer Installation -General’, above. Issue 4.2 Mount the transducers with their faces as flush to the hull as possible, so that turbulence across them is kept to a minimum. If flush mounting is impossible then a fairing must be constructed to smooth water flow across the transducer face. This helps to reduce vibration and entrained air, and helps to protect against damage to the transducers caused by striking submerged objects. The horizontal axes must be horizontal with respect to gravity, when the vessel is at survey speed. The vertical axes of the transducers must be at as near to 30 degrees, looking down from the vertical, as is possible. In other words, the face of each transducer must make an angle of 30° with vertical. July 2013 Page 5-15 Bathyswath Getting Started Section 5 Hardware Installation & Deployment Design the location of the transducers to avoid multi-path reflections from the hull or other structures. Multipath Direct path Figure 5-3 Multi-path reflections from hull The location of the transducers should be as close to the apex of the keel as is practical. The transducer pairs should be ideally laterally opposite each other. However, this is not essential, if the location of each transducer is accurately measured. Pass the transducer cables through watertight glands in the hull, or a sealed tube running to above the waterline, in order that they may be connected to the electronics. The location of each transducer must be accurately recorded, relative to some fixed point on the vessel. It is often convenient to use land-survey techniques to measure these locations. The locations must be measured in three dimensions, to an accuracy of about 10mm. Measure the angles that a normal to the transducers makes with vertical (elevation) and the fore-and-aft line (azimuth). An accuracy of about 1 degree is sufficient at this stage. The actual elevation angle of the sonar ‘boresight’ will be measured using the acquired depth data. See the Online User Guide topics on Calibration. When the vessel is afloat, record the location of the water line relative to the fixed point. The height of the vessel in the water may change as the vessel moves; this effect is called ‘squat’. This effect is difficult to assess on a particular vessel, but could be significant if ultimate depth accuracy is required. Consider consulting the manufacturer of the vessel, or using a GPS system that provides accurate height information instead. Make sure that the transducer installation will not adversely effect the operation of the vessel, or cause the transducers to be damaged. If the vessel is to lie on the bottom at low tide, ensure that the transducers are not placed in a position where they will be under mechanical stress or be abraded. Similarly, for small vessels that are routinely lifted by strops, or placed in transport or storage cradles, ensure that the transducers will be safe during such operations. Consider the effect of the transducers on vessel handling. The transducers are extremely robust, and contain no active electronic parts other than the piezo-electric ceramic elements themselves. However, a ship’s hull is a very harsh environment, so consideration should be given to ease of repair in the case of damage. 5.13.5 Attitude sensor Record the locations of the attitude sensor and the positioning aerial, relative to the same fixed point on the vessel. See sub-section 5.10, ‘Installing Position, Heading and Attitude Systems’. 5.13.6 Testing and trials On some vessels, Bathyswath may not give optimum performance due to factors such as vessel noise and aeration. Although Bathyswath is happy to give advice on installing the transducers onto Issue 4.2 July 2013 Page 5-16 Bathyswath Getting Started Section 5 Hardware Installation & Deployment a vessel, it is not possible to give guarantees that no such problems will occur. The installation plan should therefore include time for sea-trials in order to find and cure any such problems. 5.14 Bow-mount Configuration The bow-mount is one of two deployment configurations available for vessels of opportunity. For bow mounting, the pole is fitted with V-shaped brackets that fit around the bow of the vessel. The pole is then pulled back against the bow using ratchet straps. This method has the following advantages: It is very quick to fit, often requiring only a few minutes. It can be fitted to most vessels with no modification to the vessel at all. The transducers have a clear view of both sides of the vessel without needing to be below keel level. The sides of the vessel are left clear for docking. As the transducers are on the centre-line of the vessel, the effect of vessel roll is minimised. It has the following disadvantages: The straps must be kept tight; otherwise, the pole will fall off. The pole cannot be fitted to vessels whose bow angle is too shallow. In general, the bow must make an angle of less than 45° with the vertical. The water at the bow of the vessel can sometimes be aerated by the bow wave. The transducers may be lifted out of the water by vessel pitch. On large vessels, the bow can be more than the length of the transducer leads (20 metres) from a suitable location for the electronics. It is difficult to make the pole mount rigid relative to the vessel. This is a problem if the vessel’s gyrocompass is used as a heading reference. 5.14.1 Bow-mount components The installation kit consists of pole, transducers, transducer frame, attitude sensor mount, adjustable angle bracket, bow-mount brackets and adjustable ratchet straps. See Figure 5-4 below. The two bow-mount brackets are spaced on the pole so that they both make contact with the straight section of the rake of the bow. The brackets are fitted with padding on the surfaces that are in contact with the bow, in order to protect the ship. Make sure that this padding is intact before fitting the bow-mount. Issue 4.2 July 2013 Page 5-17 Bathyswath Getting Started Section 5 Hardware Installation & Deployment Bow bracket Ship’s bow Bathyswath Pole Attitude Sensor Angle bracket Transducers on transducer frame Figure 5-4 Bow-mount assembly: side view 5.14.2 Installation sequence Issue 4.2 Bolt the transducers to the cradle with the stamped ‘TOP’ labels uppermost. Attach the attitude sensor to the transducer frame. Each model of attitude sensor has a different mounting assembly to fix it to the Bathyswath frame. Some attitude sensors have locating holes that need to be correctly aligned. Ensure that the attitude sensor is located the correct way around. Attach the attitude sensor and the transducer assembly to the pole. The angle that the transducer frame makes with the pole should be adjusted at the adjustable bracket so that when the pole is secured to the bow the transducers are horizontal. Adjustment is accomplished by loosening the four bolts that run through the radiused slots. The bow angle may be estimated as follows. With the vessel at rest alongside a quay, hold an adjustable set square or mathematician’s protractor at arm’s length and use your eye to align the bottom of the square with the edge of the dock or surface of the water, and adjust the square so that the moving edge aligns with the rake of the bow. Fix the square at this angle and then transfer the angle to the bow mount (or 90 minus the measured angle, depending on the angle taken). It is necessary to know the depth of the transducers below the water line when the vessel is under-way. This depth can change with loading and speed. You may therefore find it helpful to fix markers to the pole at intervals. Electrician’s tape wrapped around the pole is good for this. Carefully record the location of each mark relative to the centre of the transducers. Using cable wraps, tidy the cables from the transducers and the attitude sensor, securing them along the pole. Shackle the ends of the long sections of the ratchet straps to the holes provided on the Vbrackets. Attach a safety line to the top of the pole and secure its free end to the vessel’s bow. Pass the connectors (take care not to drop them in the water) to the vessel, along with the free ends of the straps. July 2013 Page 5-18 Bathyswath Getting Started Section 5 Hardware Installation & Deployment Attach four ratchet blocks to secure points. Two blocks are attached on the port side, and two on the starboard side. Fix two of them 2-3 metres aft of the bow, and the other two 5-8 metres aft of the bow. Two people are now required to lift the entire assembly over the quayside into the water. A third person, on the bow of the vessel should maintain tension on the safety line attached to the top of the assembly. Once the assembly is in the water its weight will decrease and the bow person should be able to support it whilst the two persons on the quay come aboard. These two should then take the free ends of the straps, attached to the top V-bracket, and pass them along the appropriate port and starboard sides. Attach the ends of the straps to the forward pair of ratchet blocks. Use the ratchets to tension the straps so that the top V-bracket is firmly in contact with the bow. At this point, it is useful to check the alignment of the pole with the bow, and to give correcting instructions to the people tightening the straps. Once the top mount is secure, take the bottom straps to the aft ratchet blocks. Again, during tensioning the quayside person is required to assist in alignment. On completion of strap tensioning, tie off the safety line to a bow strong point. Inspect the straps to ensure that they are not twisted, and that they do not cross any sharp edges in the hull. The straps can become abraded if they rub against such sharp edges, or if they are caught between the hull and the dockside when the vessel is moored. If this is the case, then re-route the straps, or protect the straps with robust covering. An alternative to using straps is to use steel rope between the pole and the ratchet blocks. Fix the steel rope to a length of strap a metre or two on front of the ratchet block. This allows the rope to be tightened with the ratchet. Where the rope touches the hull, it could damage the hull. Putting a protective tube over the wire rope can prevent this. Garden hose is ideal for this purpose. Route the cables through the vessel and connect them to the Bathyswath electronics, as specified above. Apply power to the Bathyswath system, and start the Swath software. If the attitude system is fitted in an underwater bottle on the transducer frame, note the roll and pitch angles. Use the ‘Text' window in Swath; make sure that the angles are displayed as numerical text. The sign convention of pitch is such that it is positive when the vessel is bow-up. Roll is positive port-side up. If the pitch angle is more than two degrees from zero, consider lifting the pole and adjusting the angle bracket to bring the transducer and attitude sensor assembly level. If the attitude system is not fitted to the transducer frame, examine the angle of the seabed by eye. However, remember that the seabed under the ship in dock may not be flat. Measure the depth of the centre of the transducers, relative to the water line. Note that this can change once the vessel is moving at survey speed. It will also change with loading and the location of personnel. Use the fixed marks on the pole, if you fitted them. Record the pitch angle whilst this depth measurement is made. Also, measure the fore and aft distance from the transducers to the centre of pitch of the vessel. These measurements will allow you to estimate the change in water depth of the transducers, as the pitch of the vessel changes with speed. 5.15 Side-mount Configuration The side-mount uses the same pole, attitude sensor and transducer frame as the bow-mount, but without the angle bracket and bow brackets. Alternatively, a pole may be custom-built for a particular vessel. This may be required if the pole needs to be longer than the Bathyswath pole supplied or if a swinging pole is required to allow quick recovery at sea. The advantages of a side-mount are: Issue 4.2 It is usually more rigid than a bow-mount. It can be deployed at sea, provided that suitable fixings are designed. It is stable in pitch. July 2013 Page 5-19 Bathyswath Getting Started Section 5 Hardware Installation & Deployment The disadvantages are: A small modification to the vessel is often needed. It is less stable in roll than a bow-mount. It needs to be lower than the bottom of the hull, and is thus liable to damage from striking the seabed. This also brings it closer to the seabed, thus reducing range in shallow water. The pole may be fixed to the side of the vessel using a variety of techniques. Some vessels may have brackets fixed to their side that can be adapted for use with the Bathyswath pole. Others may need a small modification. The Bathyswath pole assembly includes a special bracket that enables the pole to be fixed to many vessels with a minimum of alterations. The simplest approach is to fix the bracket to the side of the vessel, using bolts, clamps, or similar fixings. The pole is fixed to the bracket using U-clamps. The end of the pole is pulled tight using guys running fore, aft, and sideways using a belly-strap running under the vessel to the rail on the other side. Steel rope is better for this application than rope, as it is less elastic. Screw-up tighteners (bottle screws) are useful to make the whole assembly rigid. The problem with this approach is that it can be difficult to recover and deploy at sea, so it may not be suitable if long transits to the survey site are needed. If the pole is mounted alongside an open deck area, recovery at sea can be possible. A drill for this must be thoroughly practised whilst alongside. Review this drill for safety. An pole 4off holes 12mm dia out Figure 5-5 Pole-End Plate, to fit transducer frame alternative approach is to weld U-shaped brackets to the side of the vessel, and fit the with mating studs. The pole can then be lowered into position when at sea. This procedure usually needs a hydraulic crane or winch, and can be hazardous in rough sea conditions. For this reason, another popular approach is to fit the pole with a swivelling mount at the top, so that it can be rotated up of the water when not in use. The pole can be raised and lowered using a winch, and tightened fore and aft with ropes. If a pole is fabricated specially, then it needs a horizontal square plate to be firmly welded to the end. This plate must have four 12 mm diameter holes, drilled in a square pattern on 120 mm centres. 5.15.1 Side-mount components The installation kit consists of pole, transducers, transducer frame, attitude sensor mount and pole bracket. Wire rope, shackles, bottle screws, and fixings allowing eyes to be made in the wire rope are also required. These latter components are available from most ship’s chandlers, and need to be selected to suit the particular vessel used. 5.15.2 Installation sequence The precise installation procedure will vary from installation to installation, depending on the various factors discussed above. Shackle three guy lines to the pad-eyes on the base of the pole. Three lines are required; one forward, one aft, and the third as a belly-strap. Locate hard-points for the three lines, and fix shackles to them. Two of the hard points should be as far forward and aft as practical. The third should be on the other side of the vessel, directly across from the location of the pole. Issue 4.2 July 2013 Page 5-20 Bathyswath Getting Started Section 5 Hardware Installation & Deployment Assemble the attitude sensor and transducer frame assembly. Fix the assembly to the pole. Carefully measure and record the distance from the top of the pole to: the bottom of the transducers, or the lowest point of the pole; the centre of the transducers; and the centre of the attitude sensor. It is also useful to mark the pole at intervals with tape, so that any changes in the depth of the transducers can be estimated when the vessel is underway. Estimate the depth of transducers that will be needed to clear the bottom of the hull. It is usually easiest to fix the side-bracket to the pole whilst the pole is out of the water. Estimate the correct location of the bracket that gives the required transducer depth. Fix the transducer and attitude sensor cables to the pole. Loosely fix the fore and aft guy lines to their hard-points. Run the belly-strap under the vessel, and loosely fix it to its hard-point. A shackle or similar weight loosely passed over the line will help to sink it under the vessel. Be sure that the belly-strap does not foul the propellers or other hull fixtures. Lift the pole over the side and clamp it in place. Three or more people are required for this task. Secure the three guy lines, with adequate tension to steady the assembly when underway. Care should be taken not to bend the pole too much when doing this. However, a small amount of bend in the direction of the belly-strap is inevitable. The trick here is to fix the side-clamp so that the pole is angled outwards slightly, and then to pull it in with the belly-strap. Route the cables through the vessel and connect them to the Bathyswath electronics, as specified above. Apply power to the Bathyswath system, and start the Swath software. If the attitude system is fitted in an underwater bottle on the transducer frame, note the roll and pitch angles. Use the ‘Text' window in Swath; make sure that the angles are displayed as numerical text. The sign convention of pitch is such that it is positive when the vessel is bow-up. Roll is positive port-side up. The pitch angle can usually be brought to zero by tightening and loosening the fore and aft guy lines as appropriate. The roll angle can be altered by tightening and loosening the belly-strap. If this does not provide sufficient control, place a chock on the appropriate side of the pole clamp. If the attitude system is not fitted to the transducer frame, examine the angle of the seabed by eye. However, remember that the seabed under the ship in dock may not be flat. Measure the depth of the centre of the transducers, relative to the water line. Note that this can change once the vessel is moving at survey speed. It will also change with loading and the location of personnel. Use the fixed marks on the pole, if you fitted them. Record the pitch angle whilst this depth measurement is made. Also, measure the fore and aft distance from the transducers to the centre of pitch of the vessel. These measurements will allow you to estimate the change in water depth of the transducers as the pitch of the vessel changes with speed. Issue 4.2 July 2013 Page 5-21 Bathyswath Getting Started Section 5 Hardware Installation & Deployment 5.16 Buoy Mount If Bathyswath is to be used with very small boats, such as RIBs or ‘Zodiac’-type inflatable boats, a deployment method that has been used is to construct a floating platform that can be strapped to the side or front of the boat for surveying. Such a platform can simply be constructed using the Bathyswath transducer bracket strapped to a pair of ‘sausage buoys’ or fenders. The attitude system and GPS antenna can be fixed to the top of this assembly. The system cables are then run from the buoy to the computer system inside the boat. Bathyswath users have used this method successfully to survey calm, inshore waters. However, Bathyswath can accept no responsibility for damage to equipment or risk to personnel from the use of such methods. 5.17 Final Tests and Measurements 5.17.1 Safety Once all the equipment is installed, review the arrangements for safety. Pay particular attention to the following: Ensure that all equipment and cables are firmly fixed down, so that they cannot come loose when the vessel moves. Ensure that cables do not obstruct walkways. Ensure that all connectors are thoroughly screwed home. Pay particular attention to underwater connectors, if used. Check O-rings. Ensure that all mains power cables and connectors are in thoroughly dry locations. 5.17.2 Tests Make a final check of the attitude sensor orientation, using the Swath Text view. Refer to the Online User Guide for information on testing and diagnostics. If necessary, run the attitude system calibration and set-up procedures (see section 5.10.1). Issue 4.2 July 2013 Page 5-22 Bathyswath Getting Started Section 5 Hardware Installation & Deployment 5.17.3 Measurements In order that the Bathyswath data can be processed to produce a depth model, the following measurements are needed: Measurement Accuracy Needed Typical Value Attitude time offset 0.001s Depends on the attitude sensor used Magnetic variation 0.5° Refer to local charts. Only needed if compass is magnetic Grid convergence 0.5° Depends on position grid format Aerial position relative to attitude sensor 0.01m Port-starboard and Forward-aft. Also height if using GPS heights Position time delay 0.1s Location of transducers relative to attitude sensor 0.01m Transducer mounting angles 0.1° Depth of transducers under water surface 0.01m Speed of sound 0.5m/s Tide 0.01m -1.0s Notes Best obtained using processing calibration All three directions 30° Obtained from processing calibration Measure or calculate how this changes with vessel speed and loading 1450 – 1550m/s See the Calibration section of the online user guide See the Calibration section of the online user guide 5.17.4 Fault finding Refer to the Fault Finding topics of the Online User Guide. Issue 4.2 July 2013 Page 5-23 Bathyswath Getting Started Section 6 System Configuration and Timing 6 System Configuration and Timing 6.1 Background In order to create a set of valid depth measurements, results from a number of subsystems need to be brought together. These can include: Bathyswath sonar Attitude system, providing roll, pitch & heave, possibly also heading Compass, providing heading GPS system, providing position Real-time speed of sound Echosounder Some of these subsystems can be integrated into one unit; for example, the CodaOcotpus F180 and Applanix POS/MV provide position, attitude and heading. In order to bring this data together correctly, the relative timing of all the data streams must be known. The most time-critical measurement is roll. For extremes of motion on a small vessel, a timing accuracy of better than 5ms may be needed. On a small vessel in a moderate sea, a timing error of 20ms in the attitude data is just detectable on the depth displays and data output. Pitch, heading and position are required with a timing accuracy of better than 0.5 seconds (500ms). Some survey protocols require that all data is logged with time information that can be traced back to a common time source, usually UTC time derived from GPS signals. This can be achieved using Bathyswath, but may not be supported by some auxiliary sensor systems used with it. 6.1.1 PC clock The clocks in most PC computers are not particularly accurate. PC clocks are reputed to be accurate to 30 to 100ppm (parts per million; e.g. 100ppm is 0.36s in an hour). However, the Windows operating system adds its own timing errors and uncertainties. Tip: the Windows Time Service can cause the PC time data to vary at rates of up to half a second per minute [8000ppm!]. Therefore, it can help to disable it, using ‘Settings > Control Panel > Administrative Tools > Services > Windows Time’. Therefore, a method of synchronising the PC time to GPS time should be considered. Some integrated attitude and position systems provide this as part of the supplied package. Alternatively, an NTP (Network Time Protocol) time server can be integrated into the system. If a distributed computing system is being used, and one of the PCs is acquiring UTC-GPS time, e.g. via PPS, then an NTP time server can be set up on that PC, and NTP clients set up on the other PCs in the system. These NTP servers and clients are software applications, which can be obtained as shareware products for a few tens of dollars on the Internet. Bathyswath surveys have been successfully carried out using such configurations. Issue 4.2 July 2013 Page 6-1 Bathyswath Getting Started Section 7 Software Installation 6.1.2 Serial port delays Bathyswath records the time of a data string when the first character is received, so that the time it takes for the string to arrive is not a problem. However, there can be a large and indeterminate delay in that first character arriving. Older PCs have the serial port built in to the PC card, and the timing is reliable. Newer PCs do not consider the serial port to be important, and so implement it on some kind of sub-bus, if at all: RS232 is regarded as a ‘legacy port’. This is particularly true for laptops, which rarely have serial ports fitted, and so have to use external port adaptors, using USB, PCMCIA or Ethernet. For a good USB implementation, the time delay could be as low as 10ms, but it can well be much more. Therefore, we do not recommend the use of USB-serial adaptors. Bathyswath has been tested with Ethernet USB adaptors, and shown good attitude stability. Possible mitigations include: Get a serial port system that has a delay that is either very small or deterministic and known (the Bathyswath software includes a capability to correct for sensor time offsets). Use sensor systems that are synchronised with GPS time and add this time to the data string that they send out, and configure the Bathyswath software to use this time stamp. Use Ethernet outputs from the attitude sensors. Although there is a non-deterministic delay in the Ethernet transmission, it is small enough not to cause problems to Bathyswath processing (typically 50 microseconds or less). 6.1.3 Sonar data timing Sonar data time can either be provided by the TEM’s own clock, or using the PC clock time at the time of acquiring the data. The TEM’s internal clock is accurate to about 50ppm, but it can be accurately synchronised with a time reference using a PPS input (see below). Each TEM records the time since its clock was reset, in seconds and milliseconds. The software records the PC time at which each TEM reset occurs, and generates a time stamp for each sonar ‘ping’ by adding this reset time to the TEM time clock. In PPS mode, the PC reset time is rounded down to the nearest second, and the true GPS time in seconds is added. Thus, an accurate sonar time is available to the nearest millisecond, even though the PC time is up to half a second in error. For PC time errors of greater than half a second in either direction, an error in sonar time of a whole number of seconds will be seen. 6.1.4 PPS, Pulse per Second Accurate clock systems often provide timing signals as electrical pulses sent out every second, on the second. These signals are called pulse-per-second, shortened to "PPS" or "PPS". GNSS systems such as GPS provide very accurate clock signals (a GNSS system is essentially a set of atomic clocks on satellites), so the most common source of PPS in a sonar "spread" is the GNSS system. 6.2 PPS Input to TEMs The TEMs can receive a PPS signal from an external timing system. This is often derived from a GPS input, either from a GPS positioning system, or from a dedicated timing system that uses a GPS receiver. When the TEM firmware detects a PPS pulse on its data input, it synchronises the TEM clock. See Figure 6-1. Issue 4.2 July 2013 Page 6-2 Bathyswath Getting Started Section 7 Software Installation External time system, e.g. GPS PC USB USB TEM TEM 1PPS Figure 6-1 PPS Input to TEMs 6.2.1 Connecting the PPS signal PPS is generally supplied as a BNC coax connection from the GPS system. A BNC connector is supplied on the connector face of the TIU for this purpose. The TIU PPS input is designed for high-impedance outputs. However, some systems provide PPS on a 50 output. In this case, it may be necessary to use a 50 BNC terminator and T-piece at the TIU PPS input. 6.2.2 Monitoring the PPS input The Swath software provides the ability to control the PPS input, and to monitor its status. The Sonar control dialog in the Swath program includes two controls: PPS Enable, and Rising/Falling edge The first of these tells the TEMs to use the PPS signal to synchronise their clocks (or not). The second control determines whether the rising or the falling edge of the PPS square wave signal should be used for timing. Note: the CodaOctopus F180 and Applanix POS/MV systems provide a falling-edge PPS signal. A status indicator at the bottom of the Swath program main dialog box (usually on the left of the screen) provides two status indicators: Ack, which acknowleges that the PPS signal is being received Error, which checks that the period of the PPS signal is close to 1 second, as compared with the TEM’s internal clock. The most common cause of an error of this type is if there is ‘noise’ on the PPS line, causing the TEM to trigger at times other than the correct signal edges. This might occur if the PPS impedence and termination are incorrect: see §6.2.1 above. The main dialog box also contains a ‘traffic light’ status indicator, which summarises the state of the two status indications at a glance. The Status window gives information about PPS status. Note that a PPS error state may briefly be detected when connecting or re-connecting the PPS signal, or changing the PPS state in software, as the TEM units synchronise to the regular PPS input. Issue 4.2 July 2013 Page 6-3 Bathyswath Getting Started Section 7 Software Installation 6.3 System Configurations 6.3.1 Alternatives Bathyswath is designed to operate with a range of different equipment and system configurations. However, there are broadly two options for system timing: Sensor clock timing: all sensor information is recorded using the sensor’s own clock time. This configuration provides data related to UTC-GPS time, with an accuracy of 10ms or so, but is more difficult to set up, and is only possible if the auxiliary sensor systems provide such timing information in their data interfaces. PC clock timing: all sensor information is logged using the time at which it appears at the PC for logging. This option provides a slightly less accurate solution, is prone to communications delays, and its relation to UTC-GPS time is only as good as the PC’s clock synchronisation; which could be a second or more even with Windows time synchronisation tools. However, it is significantly more robust, easier to set up, and can be used with all attitude sensors. 6.4 Sensor Clock Timing Configuration 6.4.1 Description In this mode, the sonar, and each sensor in the system, provides its data time-stamped with its own clock, and each of the clocks is tied to UTC-GPS time, using an external reference or time server. 6.4.2 Motivation This configuration gives several advantages: Errors due to unknown or variable data communication times are eliminated Attitude correction is better, as errors due to time offsets are eliminated Post-processed attitude and position data can be used, as these files are also related to the sensor clocks All data is traceable back to a global time source Data can more easily be related to data from other systems being used at the same time Some survey protocols specify such time referencing 6.4.3 Potential problems Disadvantages of sensor clock timing, compared to PC clock timing, include: It is harder to set up, requiring careful configuration of the overall system and each component Time offsets between the various clocks can cause significant errors in data processing. The most common of these is ‘roll bleed’, where vessel roll is not properly applied to the sonar data, and the vessel’s roll appears as a sequence of ‘waves’ in the seabed data. It is only possible if each sensor sub-system: o Maintains its own clock o Can be tied back to a central reference source o Provides data in a format that includes time information. Most serial data interfaces from attitude sensors do not provide such timing data: formats missing this information include the ‘EM3000’ and ‘TSS1’ formats. However, when the time data is recorded in Sensor Clock format, both the Sensor time and the PC time are recorded with each data item. Therefore, it is possible to revert to PC Clock timing in postprocessing, if a Senor timing error is discovered after the survey is complete. Issue 4.2 July 2013 Page 6-4 Bathyswath Getting Started Section 7 Software Installation 6.4.4 System diagram Usually the same system; e.g. F180 or POS/MV synch External time system, e.g. GPS synch Attitude System GPS Position System Ethernet 1PPS or NTP Ethernet Bathyswath PC USB USB TEM TEM 1PPS Figure 6-2 Sensor Clock Timing Configuration 6.4.5 Configuration settings Connections: Use Ethernet output from the attitude and position sensor, using its ‘native’ sensor format, e.g. CodaOctopus MCOM or POS/MV ‘102’ format Connect PPS from the attitude and position sensor to the TEMs (see §6.2) Use NTP or PPS to synchronise the PC clock. However: o Good sonar-attitude time synchronisation is possible provided that the PC clock is accurate to the nearest half-second in either direction o The Swath software can be configured to synchronise the PC clock to the time coming from the position system; while this is only accurate to several tens of milliseconds, it is good enough for sonar-attitude synchronisation. o If a separate NTP server is used, make sure that it keeps well synchronised with the attitude system clock Swath settings: Issue 4.2 In the initiation file, ‘swathprocconfig.txt’ (§7.4.1), set: sonar timeUpdateInterval 0 This suppresses regular TEM clock resets. In PPS mode, the TEM time should be more accurate than PC time, so it is preferable to use the TEM clock without synchronising to the PC clock in the middle of survey lines. F180socket enabled 1 … and other settings for the F180 or POS/MV, see §5.6.3 for details. (Note that the ‘F180socket’ group applies to all Ethernet-enabled motion sensors, not just the F180). July 2013 Page 6-5 Bathyswath Getting Started Section 7 Software Installation This sets the default start-up state of the software; it can be enabled using the Socket Properties dialog independantly of the setting in the initiation file. F180socket timesyncEnable 0 … if the PC time is synchronised using NTP or similar, otherwise F180socket timesyncEnable 1 … this causes Swath to update the PC time from the attitude sensor’s data streams at the start and end of survey lines (when changing the sonar from inacive to active and vice-versa). This is good enough to maintain sonar-attitude synchronisation within the necessary half-second accuracy. Note: this time-setting feature may not work under Windows Vista, due to security settings. Try disabling User Access Control. Whilst setting up the system and performing initial tests, try selecting reporting timingDebugInfo 1 This continuously prints the ping-attitude time difference to the Status window, allowing a trace of possible synchronisation errors. In the Swath program: o Configure the attitude and position Ethernet interfaces as explained in section §5.6.3. o Select ‘Sensor Clock’ in the Attitude and Position set-up dialogs o Select ‘Sonar Clock’ in the Sonar dialog. o Enable PPS in the Sonar dialog. 6.5 PC Clock Timing Configuration 6.5.1 Description In this mode, all data is time-stamped with the PC clock time at the moment of acquisition in the Swath software. 6.5.2 Motivation The advantages of this configuration are: Errors due to differences in system clocks are eliminated Errors due to drift between clocks are eliminated Errors due to Windows time sensing are eliminated It is quicker to set up It is the only possible configuration when using serial data interfaces from attitude sensors that do not include time data. These include the industry-standard TSS1 and EM3000 formats. 6.5.3 Potential problems Disadvantages of PC clock timing, compared to sensor clock timing, include: Issue 4.2 Times cannot be related back to universal UTC-GPS time to better than a second or so, and only then if the PC clock is synchronised in some way. Time synchronisation between sonar and attitude data is subject to communications delays from both systems, and therefore roll correction will not be quite as good in high roll rates. July 2013 Page 6-6 Bathyswath Getting Started Section 7 Software Installation 6.5.4 System diagram Attitude System GPS Position System serial serial Bathyswath PC USB USB TEM TEM Figure 6-3 PC Clock Timing Configuration 6.5.5 Configuration settings Connections: Use serial output from the attitude and position sensor, using a suitable data format. Ethernet data interfaces still work in this mode, but if they are available, consider using Sensor Clock timing. On a laptop computer, it may be necessary to use an Ethernet-Serial data converter. USB data converters are not recommended, as they can insert delays of several tens of milliseconds. PPS to the TEMs is not necessary in this mode, as the TEM clock data is ignored. Use NTP or PPS to synchronise the PC clock if possible. However, this is not necessary to get good Bathyswath survey results. Swath settings: In the initiation file, ‘swathprocconfig.txt’ (§7.4.1), set: o sonar timeUpdateInterval 0 This suppresses regular TEM clock resets. These are not necessary, as the TEM clock is ignored. o F180socket enabled 0 … assuming that a serial interface is being used. In the Swath program: o Configure the attitude and position serial interfaces as explained in the Online Help. o Select ‘PC Clock’ in the Attitude and Position set-up dialogs o Select ‘PC Clock’ in the Sonar dialog. o Disable PPS in the Sonar dialog. (Although there is no harm for the PPS to be running: it is ignored in this mode). Set a small delay to the attitude samples to account for serial data acquisition times: ‘Configuration > Sensor Parameters > Attitude Sensor Corrections > Time Offset’. An offset of –0.015 works well for an F180 sensor operating over a serial link. Issue 4.2 July 2013 Page 6-7 Bathyswath Getting Started Section 7 Software Installation 6.6 Monitoring System Timing 6.6.1 Motivation Especially if using Sensor clock timing, it is important that the relative timing of the components of the system is carefully monitored during the course of surveys. To do this, open a Text window, and select ‘Show Timing Data’. This monitors the current PC time, and the time of the latest sonar, attitude and position data samples, together with the differences between these. It also shows running averages for the ping-attitude and ping-position data samples. 6.6.2 Text View Note that there is no reason why any of these differences should be exactly zero, as the data is acquired asynchronously, at different rates, for each data set. (An exception is the attitude and position data if these are coming from the same sensor; in that case a zero attitude-position time can be expected). As attitude data is acquired at a faster rate than sonar data, particularly when running at longer ranges, the latest attitude sample will almost always be later than the latest ping sample, and so the ping-attitude difference will be negative, and about half the ping period. It is not appropriate to attempt to compensate for this difference, for example using the Attitude Sensor corrections settings in Swath. 6.6.3 Sonar Views Strong roll errors will show up as movement in the cross-profile displays. Note that the ‘noise’ data should roll with the vessel, but the seabed should stay level (apart from real changes in the seabed as the boat moves across it, of course). Watch the colour-depth waterfall views for signs of roll errors; on a seabed with slight slopes on it, some quite small timing errors can be seen. 6.6.4 Correcting for Timing Errors If the roll error is large, check that the transducers are connected the right way round and that the attitude sensor is correctly orientated and configured. In Sensor Clock timing mode, watch the various timing offsets. Observe the ‘now-att’ time to look for differences in the PC clock and attitude clock (this only works in real time, not from recorded data). If there is a large error (more than 1 second), check how the PC clock is being synchronised, and correct it. If there is a small residual roll error, try small time offsets in the Attitude Sensor corrections settings in Swath. If all else fails, using PC Clock timing is generally a safer and more robust option. Issue 4.2 July 2013 Page 6-8 Bathyswath Getting Started Section 7 Software Installation 7 Software Installation The Bathyswath real-time software package, the Swath Processor, or ‘Swath’, is only supported on Microsoft Windows. Real-time data acquisition, using the Bathyswath USB TEMs is only supported under Windows 7, Vista and XP. Swath will work in replay mode on most installations of Windows 2000, 95, 98, Me and NT. However, no technical support is provided for these older operating systems. The Swath application requires considerable processing power in order to store, process and display the large data volumes of data that the system acquires. See the Recommended PC Computer Specification below for full details. 7.1 Installation An installation program is provided with the swath software. This automatically installs the program and all other software modules that it requires. To install the Swath software, simply run the ‘Bathyswath.msi’ program provided. 7.1.1 Recommended PC Computer Specification Item Specification Notes Operating System Windows XP, Windows Vista, Windows 7 Bathyswath is compatible with Windows 7 64bit, though generic ‘USB Serial Converter’ signed device drivers must be used. Processor Processor P4 3GHz or better We recommend at least this processor power. The system operates more slowly on lower-powered PCs. Graphics 3D accelerated graphics card, at least 256Mb memory Must support OpenGL functionality Monitor 17” or larger It is possible to open several display windows simultaneously, so a large screen is advisable. Memory 2Gb or more The more the better, particularly for post-processing. Windows Vista needs at least 1Gb memory. Hard Drive 100Gb or more The system uses about 0.5Gb per hour, so plenty of disk space is required for storage and processing. An external USB disk drive is a practical alternative to a large internal disk drive. Issue 4.2 July 2013 Page 7-1 Bathyswath Getting Started Section 7 Software Installation Item Specification Notes DVD/CD drive Read and write DVD and CD format disks. Used for archiving data and for installing software. Again, an external USB disk drive can perform this function. Network card Standard RJ45 Ethernet For interfacing to other systems. Some attitude systems provide data on Ethernet. Serial ports 6-off RS232 ports or more For input of auxiliary data. Caution is required with plug-in units, e.g. USB; these can sometimes have an unacceptable delay between a message arriving and it being presented to software. USB ports 4-off USB ports required; at least 6 are recommended 2 for TEMs, 2 free. More needed if the system uses them itself, e.g. for mouse or DVD drive. External USB disk drives and USB ‘memory sticks’ require more ports. Mouse Wheel mouse A mouse with a wheel is essential for some of the swath controls, such as zooming and scrolling. Keyboard Windows compatible 7.2 PC Configuration This section provides tips for configuring Windows PCs to get the best performance from Bathyswath. PC computers and operating system versions and configurations vary enormously, so not all of these tips will be appropriate for every situation. Many of the comments below have been found useful on older computers. Modern PCs, even laptops, usually work well with the Bathyswath software with no modification. 7.2.1 Windows Versions Bathyswath software is currently tested to run on Windows 7. It should work with Vista and XP. It has not yet been tested with Windows 8. 7.2.2 Windows security settings Microsoft Windows is ever more security conscious. This is important for preventing viruses and other ‘malware’ from infecting computer systems, but it can prevent Bathyswath from working well and interacting with other computer systems. The ‘User Access Control’ setting can prevent some actions, for example, the option of setting the PC time from GPS messages in the Swath program. It may therefore be necessary to disable this option in Windows. For networking, e.g. connecting to Ethernet attitude systems, check the Windows Firewall settings. Even for stand-alone survey laptops, the use of a good-quality virus checker and firewall is highly recommended. 7.2.3 Windows performance settings Windows performance can be maximised by selecting ‘Settings > Control Panel > System > Advanced > Settings > Adjust for best performance’. Issue 4.2 July 2013 Page 7-2 Bathyswath Getting Started Section 7 Software Installation 7.2.4 Hyperthreading On PC systems that provide the ‘Hyperthreading’ feature, it is recommended that it is disabled. Use ‘Drivers > Computer’. Set the computer driver to ACPI (it defaults to ACPI multiprocessor). The Swath processor is a highly threaded application (a thread is a semi-autonomous ‘subprogram’ running inside the main application). The relative operating priorities of the threads are carefully selected and balanced in Swath; Hyperthreading appears to disable this prioritisation. 7.2.5 Multi-core processors Some users have found that Swath seems to run slowly on dual processor machines. Better performance can sometimes be obtained by setting the processor affinity to just one core. Either: In swathprocconfig.txt, set ‘PCHardware setSingleProcAffinity 2’. (If zero, Swath uses all cores. If 1, it uses core 1. 2 > use core 2. Find Swath in the Task Manager, right-click, select ‘Set Affinity’ and un-click one of the cores, Or use a tool that sets this automatically when a program runs. Such tools are available as freeware downloads from the Web. 7.2.6 Windows Time Service The Windows Time Service helps to keep the PC time synchronised across a network. However, it can sometimes make system timing considerably worse, particularly on stand-alone systems. It is therefore recommended that this service is disabled on survey computers, unless it is specifically required. It can be accessed using ‘Start > Settings > Control Panel > Administrative Tools > Services’, and then scrolling down to ‘Windows Time’. 7.2.7 Screen savers and power-off modes For survey use, disable screen savers and power-off modes. 7.2.8 Display resolution A high screen resolution is recommended: at least 1280x1024. 7.2.9 USB hubs Bathyswath TIUs are fitted with an internal USB hub to connect its TEMs to the computer, so a single USB port is provided, When working with older SWATHplus TIUs, USB TEMs can be connected to the PC using a USB hub. For some systems, better performance can be obtained by connecting the two (or more) TEMs to the PC using a good-quality USB 2.0 hub, (usually with an external power supply). This performance can be assessed by opening Swath, setting the Ping Range to a short range (say 5m), and checking the ping rate in the bottom right-hand corner of the Swath window. 7.3 To Install USB TEMs 7.3.1 Summary When plugged in for the first time, USB TEMs are auto-detected by the Windows software, which then asks for the information needed to install the necessary drivers. For further information see the accompanying document ‘Installing Bathyswath’ 7.3.2 Installing USB drivers without the hardware The software may still ask for the USB TEM drivers, even if it is only to be used for replay. In this case, the driver can be installed without the hardware as follows: Issue 4.2 Navigate to the location where the SWATHplus is installed. The default is ‘C:\Program Files\Bathyswath\Bathyswath’ July 2013 Page 7-3 Bathyswath Getting Started Section 7 Software Installation Find the file ‘FTDIbus for TEM i386.inf’ or ‘FTDIbus for TEM x64.inf’ depending upon the system, right-click on it, and select ‘Install’. 7.4 Software Settings Files The Swath Processor program can be configured to work in many different configurations. The configuration details are stored in several different files, as appropriate to the configuration information stored. These are: The Bathyswath settings file, which has the file extension ‘.sxs’. This stores the details of a survey ‘session’, including: o The sonar settings (transmit power, ping length, etc.) o The auxiliary system settings (serial port number and baud rate, data format, use of auxiliary systems for creating attitude data) o Positions and angles for all of the system components o Correction offsets and multipliers for all data types o Filter settings o Location and settings of display windows The Windows registry: this stores information such as the previous files and directories used, so that the user does not have to search the whole directory tree each time a new file is used The swath processor initiation file. This stores information about the context of the computing system and other such start-up information. This file is not intended for the use of the general user, but rather is for installation and maintenance engineers. This file is always called ‘swathprocconfig.txt’. Details are supplied below. The Configuration file. This file stores the sub-set of data in the Swath settings file that concern the configuration of the sonar system, and is only used to transfer such information to and from external utility software. 7.4.1 Swath processor initiation file This file stores ‘fixed’ information about the context of the computing system. This file is not intended for the use of the general user, but rather is for installation and maintenance engineers. Entering the wrong parameters into this file can cause the system to work incorrectly or not start up at all. If in doubt, do not edit this file. This file is always called ‘swathprocconfig.txt’, and is stored in the same location as the swath processor executable, ‘swath.exe’. Note: in Windows Vista, it may be necessary to take a copy of ‘swathprocconfig.txt’ in another location, edit it there, and then copy the edited file back into the ‘Program Files’ location. The swath processor initiation file is an ASCII text file. It consists of a set of entries, each entry being on one line of the file. A typical entry line consists of three words, separated by white space (spaces and tabs). The first word is the entry group, the next specifies the entry item, and the third gives its value. The entries do not need to be in any particular location in the file, but if an entry type is repeated, then the information in the latest one in the file over-writes the information in any earlier ones. A typical entry is: sonar hardwareFitted 1 The group is ‘sonar’; there may be other entries that define the sonar settings. The entry is ‘hardwareFitted’; this particular item tells the software whether to expect Bathyswath TEMs to be accessible to it. The third item is set to ‘1’, meaning in this case that the hardware is expected. If no hardware is expected, set this item to ‘0’ (zero). This particular setting can be useful when the Swath Processor is installed on a system that is only used for post-processing, and it prevents the software from issuing a warning when it cannot find any Bathyswath hardware on start-up. Other useful settings include: Issue 4.2 July 2013 Page 7-4 Bathyswath Getting Started Section 7 Software Installation The ‘preset’ group: this defines the pre-set filter settings used in the first window of the bathymetry filter dialogs. The meaning of each setting should be obvious in comparison with the bathymetry filter dialog items. The ‘synchsocket’ group is used to set up systems where two copies of the Swath Processor are used on two computers connected by a TCP/IP link, for example over an Ethernet cable or wireless link. Typically, the first system gathers the data from a sonar, and the second is used for processing and display. The ‘F180socket’ group sets up the TCP/IP data for an attitude system that provides its data over a TCP/IP link. See §5.6.3. The ‘buffer’ group defines the size of data buffers used for storing system data. In rare cases, it can be necessary to increase a buffer size for an auxiliary sensor that is providing its data at an unusually high rate. Conversely, if it is necessary to reduce the memory load of the application to allow it to run on a computer with limited capacity (perhaps on a remote platform), then these buffers could be reduced in size (but make sure that the system is thoroughly tested after doing so). 7.5 Starting the Software Windows provides several ways of starting software. Most users have their own favourites. The options include: The Windows ‘Start’ button. The installation program adds a ‘Bathyswath’ item to the start menu. Select ‘Swath processor’ for the real-time and processing program, and ‘Grid Processor’ for the post-processing QA, calibration and gridding program. Double clicking on the ‘swath’ icon in the Bathyswath program directory from the Explorer program. Double clicking on the icon of a swath session file (.sxs) in the Explorer program. This option opens the selected session file within swath, and thus provides the settings that were stored in the session file. Unless a specific session file was selected to open the swath program, swath starts with a ‘blank’ session file. This uses a default set of settings, which are designed to work in many situations. However, carefully check all the settings that this provides, and ensure that they are all appropriate to your installation. Once you have made these checks, and ensured that they all work, you may wish to save the session file as a ‘template’ for use as a starting point in later work. For example, once you have set up the communications port parameters for the auxiliary equipment, and entered the sensors’ positions in the Configuration dialogs, save the session file as, say ‘setup.sxs’. Then, use ‘Save As’ to save the file again, using a name that applies to the current project. This time, add the parameters that only apply to the current project, such as speed of sound and tide. Finally, use ‘Save’ again, to ensure that this information is not lost in the event of a power failure, etc. 7.6 Using the Software The Bathyswath software is described in section 3.6. Full instructions for using the software are in the Online User Guide. You can access this by clicking on the Contents option on swath’s Help menu. The Grid Processor program has a separate manual. This is accessible from the Bathyswath entry in the Windows Start menu. 7.7 Use with Real-Time Third-Party Applications The Swath processor can be used with several third-party sonar processing and visualisation packages in real-time. These include QINSy (from QPS), PDS2000 (from Reson), Hypack (Hypack Inc.) and SonarWiz (Chesapeake Technology International). The Swath processor sends data to the third-party application using the ‘Parsed Data’ format, on a TCP/IP link. This link can either be set up with both processes running on the same computer, or on different computers connected by Ethernet. Issue 4.2 July 2013 Page 7-5 Bathyswath Getting Started Section 7 Software Installation 7.7.1 Configuring the software The Swath processor can be configured either to run all its processes and displays, as per standalone operation, or the processing and displays can be suppressed to save on memory and processing power. The latter is usually preferable if both processes are running on the same computer. To use Bathyswath with these applications: 1. Install the Bathyswath hardware and software for a standalone operation. 2. Start the Swath Processor, and click on the ‘Socket’ button in the Main Dialog Bar. 3. Select ‘Enable’ 4. Determine whether Swath is to act as the Server or Client in the TCP/IP connection, and select in the Socket Properties dialog. QINSy and Hypack are configured as clients, so select Server in this case. 5. Select ‘Send’ 6. If using the Swath processor and the third-party application on separate computers, set the IP address of the other computer in the ‘IP Address’ box. Otherwise, enter ‘127.0.0.1’. This is the code for a ‘localhost’: the ‘Local PC’ button enters this address for you. 7. To configure a network between two computers: a. Connect the Ethernet ports of the two computers. This must be either through a network hub, or using a crossover cable. b. Configure the IP address of the two computers so that they are on the same sub-net. For example, two computers might be set ‘192.168.0.1’, and ‘192.168.0.2’, and the sub-net mask of both of them set to ‘255.255.255.0’. The IP address of a Windows XP computer is set using ‘Start > Settings > Network Connections > Local Area Connection > Properties > Internet Protocol (TCP/IP) > Properties’ Issue 4.2 July 2013 Page 7-6 Bathyswath Getting Started Section 7 Software Installation 8. Select ‘Bathyswath Parsed’ 9. To use the displays and processing in the Swath processor, alongside the thirdparty application, de-select ‘Suppress processing after sending data on socket’. Otherwise, select this option. 10. If the third-party application is the main processing, visualisation and data storage tool in the set-up, enable ‘Block pinging if socket blocks’. This causes the Swath processor to wait until the previous data packet has been sent over the socket link before sending the next one. If this option is left clear, the Swath processor continues to the next ping when the socket blocks, and the receiving process will miss pings. 11. Click the ‘Parsed Data Properties …’ button. 12. Select the settings suitable for the receiving process: a. QINSy and Hypack use the filter results in the data sent to them, so select ‘Filter Results’. b. Select which filters to use and their settings. These values are similar to those used in the Swath processor bathymetry filters, so those filters can be used together with the Swath displays to experiment with suitable settings. c. If the volume of data passing across the link is too great for either the communications link or the receiving process, down sample the data, first by selecting ‘Remove Filtered Data’, and if that is still not enough, use ‘Downsample to’. d. Note that some receiving processes (including QINSy) over-write the controls in this dialog by command messages sent to Swath over the TCP/IP link. To disable this feature, de-select ‘Allow External Control’. Issue 4.2 July 2013 Page 7-7 Bathyswath Getting Started Section 7 Software Installation This is particularly necessary if Swath and the third-party program are not working to exactly the same version of the interface. 13. Click ‘OK’ in both dialogs. 14. Watch the Status view for information about the state of the link. When the link is configured as a Server, to receive connections from the other process, the following message appears in the Status view: 15. When the other process makes a connection, the following status message appears: 16. The status of the socket can be checked at a glance using the ‘traffic light’ indicators in the Main Dialog Bar. However, a green light is no guarantee that the other process is successfully receiving and processing data, only that it is being sent without errors. The indicator goes amber if the socket ‘blocks’. 17. Save the session file to save these settings. 18. The connection can also be tested by using a second copy of the Swath processor as the receiving process. Configure the second Swath processor with ‘Receive’, and ‘Client’. Both Swath Processors will need to be configured with session files specifying the correct attitude and position decode methods, etc. If using Bathyswath and the other process on two separate computers, make sure that the two computers’ clocks are well synchronised. This can be achieved using an NTP server and client. For example, if the computer running the other process is synchronised to GPS time with PPS signals and ZDA messages, run an NTP server on the other computer and an NTP client on the Bathyswath computer. NTP server-client applications can be obtained cheaply as Internet shareware packages. See section 6. 7.7.2 Using third-party tools for both bathymetry and sidescan Most third-party surveying software tools can process both bathymetry (depth) information and sidescan imaging data. However, the input requirements of these tools are often different for the two tasks. Bathymetry data is usually best filtered and down-sampled in the Bathyswath Swath Processor software before sending to the third-party tool. This prevents that application from being ‘swamped’ with too much data. Sidescan data requires all of the ‘raw’ data to provide good images. The filtered and down-sampled data does not provide high-resolution sidescan images. Swath Processor provides a second TCP/IP port. This is useful for third-party applications that handle sidescan data on a separate port to the bathymetry data. In this case, set the Parsed Data filters differently in the second port to support sidescan data. Using ‘All Filters Off’ is suitable for most sidescan-reading systems. Issue 4.2 July 2013 Page 7-8 Bathyswath Getting Started Section 8 Using SWATHplus for Surveying 8 Using Bathyswath for Surveying Once the hardware and software are installed, as described in the previous sections, you are ready to use Bathyswath for hydrographic surveying. The real-time software (Swath) is used to set-up, control and run all aspects of the survey, including data collection, processing and recording. Detailed instructions for using Swath are on the Online User Guide of the software. You can access this by clicking on the Contents option on the software’s Help menu. The Online User Guide also contains advice on the practical aspects of planning and preparation for carrying out a survey using Bathyswath, including calibration and quality control. 8.1 Checks Before Surveying This section summarises the checks that need to be made before each survey. A number of check sheets and crib sheets are referred to in this section. Copies of these are provided with the Bathyswath software. 8.1.1 Common checks All sensors and interfacing need to be tested prior to survey. This will include the sensor message streams, as well as interfacing between acquisition computers. All sensors should be checked to ensure that the messages being output are correct for the survey, and that equipment is set up for use with the correct accuracies. For example, check that GPS corrections are received and the resolution of the GPS position is as specified for the job. Alarms should be activated in equipment to activate at the appropriate levels in both the sensor and any acquisition software. Position system confidence checks also need to be undertaken (section 8.3). Survey data is cross-referenced by position and time. When collecting data, all sensors must be acquired on the same time base so that they can be correctly geo referenced. All acquisition computers need to be synchronised with each other and against GPS or UTC time. A number of the acquisition programs have synchronisation function to set the computer clock using the GPS time from the position input strings. The time set in this way can be variable and be subject to any latency in the interface as well as the 15ms time resolution accuracy that is generally available under Windows PC. This is not necessarily a problem, as a number of the sensors provide data that is time stamped at the sensor, but quite a few do not, and if these data sources are high frequency then latencies will be seen in the data. Acquisition programs often allow the user to correct for these latencies, but this can be variable in its success. Depending on computer loading and interface type, latencies can be seen to be variable through the interface, as well as be vulnerable to a 15ms jitter if time-stamped at the PC. It is recommended that if any sensor or computer can be set up to use a PPS source from a GPS then they should be set to do so. It is also highly recommended that an NTP time server and clients are used to keep the PCs used for acquisition in line, as NTP software will maintain the computers clocks to a higher accuracy than one of synchronisation functions. This is probably best achieved using an independent NTP server. In this case, all the acquisition computers will need to be networked and running NTP client software. Given this arrangement, all PCs will be synchronised. It may also be possible to achieve this by using a PPS controlled computer as the NTP server, but the problem with this solution is Issue 4.2 July 2013 Page 8-1 Bathyswath Getting Started Using Bathyswath for Surveying that some of the PPS solutions provided by survey software will maintain survey acquisition clocks, but may not maintain the PC clock. This is certainly the case for Hypack, and may be the case for QINSy and PDS2000. Care also needs to be taken to check all equipment is installed correctly and that all cabling is safe and does not interfere with other systems. 1.1.1 Bathyswath hardware checks Section 5 covers installation and deployment issues to note for Bathyswath and auxiliary sensor installation. Pay particular attention to sections 5.10, ‘ Installing Position, Heading and Attitude Subsystems‘, 5.12 ‘Transducer Installation – General‘, and 0, ‘Connect the power to the power inlet port on the TEM housing. The TIU takes DC power, 9 to 32 V, and it is supplied with a mainsto-DC converter unit. DC power can be provided from a ship's power system or from a separate battery. The TIU works with one or two 12 V lead-acid batteries. If working with mains power, connect the mains-to-DC converter to the mains supply and the output lead to the TIU. Grounding and Earthing‘. For grounding and earthing, set the sonar to be active but not transmitting. Check the amplitude level seen without the transducers connected. The base level in the amplitude window should be as low as possible, 10k is ideal, but certainly lower than 20k to get good results. If spikes or sine wave seen then a sea earth may need to be run to the various sensors, but try a sea earth to the TIU first. Pay particular attention to any sensor powered by a battery or connected to the acquisition computers via RS232 serial connections. In addition to these general installation procedures, the Bathyswath system needs to be tested in line with the maintenance procedures listed in section 10, ‘Maintenance‘, particularly section 10.1, ‘Daily, and Before Leaving Port‘, and section 10.2, ‘Weekly, and Before Each Survey‘. 8.1.2 Calibration Before surveying, all the equipment in the survey spread needs to be calibrated. This includes: The Bathyswath electronics in the Transducer Interface Unit (TIU) Sensors, such as the attitude sensor Position system Relative linear and angular offsets for all components Also see section 10.2, ‘Weekly, and Before Each Survey‘, and ‘About Calibration’ in the Bathyswath Online Help. 8.1.3 TIU hardware calibration At the beginning of every survey it is advisable to check that the Transducer Electronics Modules (TEMs) in the sonar electronics box, or TIU, have the same values as they did on delivery from the manufacturer. The TIU electronics are tuned at the factory so the phase measurement electronics give a zero value. This can be checked by using the temcal.sxs swath session file, and selecting ‘Calibrate’ under the sonar dialogue. The phase offsets found are listed under the phase offset dialogue found under the configuration menu. The tests should be undertaken with the transducers attached. This procedure is detailed in section 10.2.1. If the values differ from factory calibration or from the previous survey calibration values, they must be noted in a phase offset table, and be entered in any session file used to acquire or process the survey data. The phase offsets should be entered and applied in the ‘Phase Offset’ dialogue under ‘Configuration’ in Swath. These offsets are used to correct any phase offset misalignments in the TIU so that the sounding angles determined are correct. The phase offsets must be correct when the patch test data is processed. 8.1.4 Sensor calibration Before any swath sensor patch test can be conducted, the sensors being used for the survey must be calibrated following the procedures outlined by the sensor supplier. Such sensor calibrations Issue 4.2 July 2013 Page 8-2 Bathyswath Getting Started Using Bathyswath for Surveying include magnetic compass environment calibration and dual antenna GPS heading system calibration. 8.1.5 Sensor offset measurements Offset measurements must be noted for each sensor. These include measurements required for the sensor set-up, and offsets between each sensor. A ‘common reference point’(CRP) should be chosen for the survey. This is often the centre of the motion sensor, but it could be at any convenient location to which everything can be measured. The CRP is the position and height datum for the vessel, and offsets are be measured in reference to it. ‘Lever arm’ corrections need to be applied between the motion sensor and the sonar transducers, so that the motions applied are correct for the position of the sensors. This can be done in either the sensor, or the acquisition software, but not both. Applying lever arms within a motion sensor, especially if it is a combined motion, position and heading sensor such as the POS/MV or F180 will give more accurate results than those applied in software, but may be more difficult to correct for later if the lever arm is applied incorrectly in the instrument. Vessel offset diagrams are provided with the Bathyswath software to codify sensor positions and offsets as well as define the survey reference point. Additionally, a ‘Configuration Reference Sheet’ has been provided to guide the operator on the correct place to input sensor offsets and corrections in the Swath acquisition software. Ideally, all offsets should be measured using a ‘total station’ land survey instrument, but steel tape, laser levels and plumb bobs can be effectively used if care is taken for the progression of measurements through bulkheads or outside to inside the vessel. If possible, all measurements should be taken to an accuracy of 1cm. Also determine static transducer draft, settlement and squat corrections, sound velocity corrections, and tide corrections. Apply these to the data prior to bias determination (patch test calibration), and system accuracy tests. 8.2 Sensor Misalignment (Patch) Test Prior to commencing survey operations, the operator should conduct a patch test to quantify the accuracy, precision, and alignment of the swath system. The patch test is used to determine any residual biases (misalignments) in roll, pitch, heading, and navigation timing error. These values will be used to correct the initial alignment and calibrate the swath system. The sensor offsets are derived from post processing the patch test survey lines. The patch test has a number of defined line patterns that need to be run or derived in a particular order. The survey line patterns required to be run to derive sensor misalignments on the survey vessel are shown in Figure 8-1. These diagrams show patterns used both for beam-forming multibeam systems and for Phase Differencing Bathymetry Sonars (PDBS) such as Bathyswath. When collecting the patch test survey lines, line keeping and vessel speed are important, and harsh or sudden changes in direction or speed (except where specified) should be avoided. The order in which the sensor misalignments and biases are determined may affect the accurate calibration of the swath system. The operator should determine the biases in the following order: pitch, navigation timing error, roll and heading. Variations from this order, or simultaneous determination of all values, may need to be undertaken in certain conditions, but any variation and reason for it should be noted by the operator. Heave should be observed in no coarser than 0.05 metre increments. Roll and pitch shall be observed in no coarser than 0.1 increments. Heading should be observed in no coarser than 0.5 increments. Navigation timing error should be observed in no coarser than 0.01 second increments. Pitch and navigation timing error biases should be determined from two or more pairs of reciprocal lines 500 to 1,000 m long, over a smooth distinct slope, perpendicular to the depth curves. The lines should be run at different speeds, varied by up to 5 knots, for the purpose of delineating the along track profiles when assessing time delay. Navigation timing error bias could also be determined from running lines over a distinct feature (i.e., shoal) on the bottom, as long as the feature is pinged by the vertical (nadir) beam. Issue 4.2 July 2013 Page 8-3 Bathyswath Getting Started Using Bathyswath for Surveying Roll bias calibration uses a series of lines that are run to provide a 100% overlap of port-to-port and starboard-to-starboard transducers. The preferred line pattern, as well as alternative patterns to be used in restricted conditions, is outlined in the patch test crib sheet. Heading bias should be determined from two or more adjacent pairs of reciprocal survey lines, made on each side of a submerged object or feature (i.e., shoal), in relatively shallow water. Features with sharp edges should be avoided. Adjacent swaths should overlap by 10–20 percent while covering the shoal. Lines should be run at a speed that will ensure significant forward overlap. The operator should note the exact procedures run, the order and results. This information is important to allow the post processing personnel to determine and check the system alignment of the sensor, the accuracy, and produce a calibration and system performance reports. Once calibration data have been processed and final system biases determined, the new corrections can be used in a system accuracy test to ensure that the new system biases are adequate. The test should be conducted in an area similar in bottom profile and composition to the survey area, and during relatively calm seas and conditions to limit excessive motions and ensure suitable bottom detection. In addition, the system accuracy test should be conducted in depths equivalent to the deepest depths in the survey area. The system accuracy test is basically a set of at least three overlapping lines, with at least one cross line run orthogonal to the main survey lines. The patch test and system accuracy tests should be repeated whenever changes (e.g., sensor failure, replacement, re-installations, re-configurations, or upgrade; software changes which could potentially affect data quality) are made to the system’s baseline configuration, or whenever assessment of the data indicates that system accuracies do not meet the requirements specified for the project. Issue 4.2 July 2013 Page 8-4 Bathyswath Getting Started Using Bathyswath for Surveying Figure 8-1 Patch Test Patterns Issue 4.2 July 2013 Page 8-5 Bathyswath Getting Started Using Bathyswath for Surveying 8.3 Positioning System Confidence Checks Confidence checks of the primary positioning system should be conducted and recorded in the survey records at least once every week. A successful confidence check should compare positions from the primary system to simultaneously observed check positions from a separate, independent system with a positional accuracy better than 10 metres. The inverse distance should not exceed 10 metres. The primary and secondary positioning systems should use different correction sources/systems. The confidence checks should be an integral part of the daily survey data record. 8.4 Crosslines 1.1.1 General The regular system of survey lines should be supplemented by a series of crosslines for verifying and evaluating the accuracy and reliability of surveyed depths and plotted locations. Crosslines should be run orthogonally or diagonally across the planned survey. The length of crosslines for swath surveys should be at least 5 percent of the length of all planned main survey lines. Comparisons should be made between main scheme lines and crosslines at 1% of all crossings (or 25 crossings, whichever is greater) distributed throughout the data both spatially and temporally. At these crossings the nadir or near-nadir depths of main scheme lines should be compared to each of the nearest unsmoothed soundings obtained from the crosslines. In addition, the nadir or near-nadir depths of the crosslines should be compared to the nearest unsmoothed main scheme soundings. The operator should perform a separate statistical analysis as a function of beam number/distance from nadir for each of the mains scheme - crossline intersections used for comparison. 1.2 Routine Survey Checks The following ongoing survey checks should be undertaken and logged: Positioning confidence checks Bar checks Draught checks Cross-line analysis Sun-illuminated images Single beam - swath comparisons Primary / Secondary navigation system comparisons Sound velocity measurement (and its correct application to echosounders and software). In addition to the above, the operator should perform spot-checks of the quoted error/uncertainty budget to ensure compliance. 1.3 Uncertainty Budget Analysis for Depths This was previously known as error budget analysis, but the term error implies something that can be absolutely measured, which is often not the case in hydrographic surveys. For this reason the term uncertainty has now introduced instead of error. Literature regarding hydrographic survey and standards are currently in transition, so the terms uncertainty and error should be seen interchangeable, as sometimes both will appear within a single document. The uncertainty associated with bathymetric measurements includes (a) uncertainty in the location of a measured bathymetric data point; (b) uncertainty in the depth associated with a bathymetric data point and (c) uncertainty in the backscatter strength associated with a bathymetric measurement. Bathymetric uncertainty management involves both the design of a bathymetric system and the evaluation of results and products derived from bathymetric data. Measurements are always uncertain, to a greater or lesser degree. Uncertainties are of three fundamentally different types: accidental, systematic and random. Each type must be dealt with differently. A common characteristic shared by all three, however, is that the reliability with which we can determine uncertainty is completely dependent upon the degree to which the bathymetric data is redundant Issue 4.2 July 2013 Page 8-6 Bathyswath Getting Started Using Bathyswath for Surveying (repeated measurements of the same seabed feature, or even footprint, which can be directly compared to ascertain consistency). The operator should endeavour to minimize the uncertainties associated with the determination of depth (corrections to echo soundings). Uncertainty estimate ranges for six of the most common uncertainties (measurement uncertainty, transducer draft uncertainty, settlement and squat uncertainty, sound velocity uncertainty, heave uncertainty and tide/water level uncertainty) are presented below. These uncertainties are inherent to hydrographic surveying and all have practical minimums that are usually achievable only under ideal circumstances or with highly specialized equipment. In addition, some uncertainties may be dependent on depth (e.g. sound velocity). Maximum allowable uncertainties are specified to ensure that all error sources are properly managed. It should be noted that if the maximum value for each error source is used in an uncertainty budget (i.e. root-sum-squared), the result will exceed the prescribed accuracy standard. This is often known as the TPE (total propagated error) for a system, but again should be more correctly termed TPU (total propagated uncertainty). The minimum and maximum values discussed below are at the 95% confidence level (i.e. 2 sigma). These values are in line with the standards specified by a number of organisations, including IHO, NOAA and USACE (US Army Corps of Engineers). 8.4.1 Measurement error This includes the instrument error for the sounding system, the effects of imperfectly measured roll and pitch, and errors in detection of the sea floor due to varying density of the bottom material. Swath systems are particularly susceptible to this error due to the off-nadir nature of outer beams. The minimum achievable value is expected to be 0.2 metres at 10 metres depth. The maximum allowable error is 0.3 metres plus 0.5% of the depth. 8.4.2 Transducer draft error This error is controlled by variability in vessel loading, and the techniques used to measure and monitor transducer draft. This error is depth independent with an expected minimum of 0.05 metres and an allowable maximum 0.15 metres. 8.4.3 Settlement and squat error Conventional methods of determining settlement and squat are limited by sea surface roughness and proximity of a suitable location to the survey area. Careful application of direct height measurement methods, such as Real Time Kinematic GPS, will minimize this error. This error is also depth independent, although the effect of settlement and squat is greater in shallow water. The practical expected minimum is 0.05 metres and the allowable maximum is 0.2 metres. 8.4.4 Sound velocity error The factors associated with this error include (1) the ability to accurately measure sound velocity or calculate sound velocity from temperature, conductivity and pressure, (2) the spatial and temporal changes of sound velocity throughout the survey area and (3) how the sound velocity profile is used to convert measured time to depth. In addition, this error encompasses depth errors associated with refraction for swath systems. The expected minimum is 0.2 metres and the allowable maximum is 0.3 metres plus 0.5% of the depth. 8.4.5 Heave error This error is directly dependent on the sea state and the sensitivity of the heave sensor but is not dependent on depth. The expected minimum is 0.05 metres and the allowable maximum is 0.2 metres. 8.4.6 Tide/water level error The practical minimum is 0.2 metres and the allowable maximum is 0.45 metres. Issue 4.2 July 2013 Page 8-7 Bathyswath Getting Started Using Bathyswath for Surveying 8.5 Environmental Measurements 8.5.1 SOS – Speed of Sound The sound velocity profile must be known accurately in swath sounding for two reasons. First, as in all echo-sounding, the depth is computed from the product of the velocity and the elapsed time between transmission of a sound pulse and reception of its echo. Second, since sound pulses travel at oblique angles through the water column, variations in the velocity profile will affect the path of sound through water. The sound path from the transducer to the bottom and back will affect not only the observed depth of water, but also the apparent position of the observed sounding. With very wide swath systems, correction for speed of sound is extremely important to reduce the effect of any sound path refraction. In areas where the speed of sound at the surface is likely to change significantly across the area, a surface mounted continuous-reading SOS sensor should be used on the sonar head. This surface sensor can be directly read by the Swath acquisition software. A surface probe will allow the operator to monitor changes in SOS in real time and help aid decisions on when and where to take a SOS profile. A SOS profiler is essential equipment for multibeam or swath data collection. If a choice needs to be made between a surface probe or a profiler, choose the profiler. A profiler works best if it is independent and self-recording, rather than tethered, as this will allow use over a greater range of depths. The profiler should be set to take a reading based on pressure at roughly every 0.5m to 1m intervals, depending on water depth. Use 0.5m triggering in water less than 10m deep. The profiler should be a direct reading SOS meter, rather than a CTD (conductivity, temperature and depth), as this will give a more accurate reading for SOS. SOS probes and profilers need to be calibrated yearly to check and maintain the accuracy of the instrument. A SOS profile should be taken after arriving in the survey area. This will check that the equipment is working and the data can be downloaded; as well as allow the operator to survey using valid SOS data. A SOS profile should be taken regularly. If a surface probe is used, then this can be used to monitor changes during the survey to allow the operator to make a decision on when to take a profile. It is advisable to take a profile at the start and end of the first line in the area to check whether the SOS profile is uniform within the area. Profiles should also be taken at the start, middle and end of the day, but need to be taken at a frequency sufficient to be able to track changes within the survey area. When a profile is taken, the time and position of the profile should be noted and logged. In the swath program, in the SOS dialogs, there are 'Here' and 'Now' buttons to help the operator capture this information. SOS can vary greatly depending on what environmental regime you are under. In a river you would expect the SOS to be well mixed and fairly constant, but be aware where other river or streams enter the river, and also close to the coast. Estuarine areas can be particularly difficult, having river outflow making water brackish. There can be a salt wedge or fresh water surface layer. In these conditions, SOS profiles should be frequent, and survey lines should be short and within discrete areas to try to mitigate any problems that the conditions may present. Coastal bays can present problems where the shallow water can experience warming, but may also have fresh water discharge from rivers. Offshore areas may show a significant change in the profile in deeper water. 8.5.2 Tide and Height Datum Depths measured by a sonar system need to be referred back to a common height datum. Even if this is not a requirement for charting purposes, it is necessary in order to be able to merge survey lines taken at different times within the same area. Height datum control can be provided in a number of different ways, but the most common are to use GPS height or to use tide tables. 8.5.2.1 GPS height Kinematic GPS, real time or post processed, will provide the actual height of the vessel and sensor, and so track directly any height changes at the vessel, relative to a geoid height. Most GPS sensors provide heights relative to the WGS84 datum. The Swath program includes the facility to perform geoid conversions on input positions. Issue 4.2 July 2013 Page 8-8 Bathyswath Getting Started Using Bathyswath for Surveying GPS height should only be used if the height accuracy from the GPS is 10cm or better. This is usually not the case for standalone GPS or differential GPS (DGPS). If GPS height is used, the Swath program provides the option of merging in heave data from the attitude sensor. 8.5.2.2 Tide If GPS height is not available at sufficient accuracy, heights are first processed relative to the water surface, and then the height of the water surface is added. This water height is what we call tide, and it changes with time. Therefore, a set of tide tables is needed, logging tide height with time. Predicted tide data is usually not sufficiently accurate for good surveying. Therefore, a tide gauge should be installed within the survey area; or a number of gauges if the area is extensive. It is always good to have some redundancy for height control measurement. This can be provided by tidal observations from local ports and harbours, or from ground staff observing any changes over time at particular points on the shore or river bank within the survey area. Observations need to be taken frequently enough to track any significant changes in height, and at a maximum interval of 30 minutes. The position of any height control point needs to be noted, as well as the height relative to the datum being used, e.g., chart datum, local level, or mean sea level. 8.5.2.3 Lakes, rivers and canals Height changes within lakes and river or canal sections should be monitored, even if RTK GPS height is being measured. In rivers and canals a height station should be set up, and measurements should be taken at the start and end of every section surveyed. 8.5.3 Positioning The position of the sonar system has to be recorded at all times in a survey, and the quality of that position data must be carefully monitored throughout the survey. See section 5.10.3 for information on installing position sensors. Position accuracy can be prone to environmental problems in particular areas. Areas to be aware of include rivers or canals with significant trees lining the bank, urban corridors, bridges and overhead obstacles. In these conditions, radio or GSM modem corrections for DGPS or RTK may have problems, with some areas experiencing dropouts. Radio modems tend to require line of sight, so will be affected in urban or tree-lined corridors. GSM modems will suffer from any cell phone coverage issues. GSM modems use GPRS data streams whose bandwidth may be reduced at peak times, increasing latency or even causing a failure in the communication of corrections. Overhead obstacles, urban or tree-lined corridors may also cause multi path issues for the corrections as well as for the GPS position. As a backup it is best to record the corrections and the vessel position independently so that post processed position and heights can be derived if necessary. It is also advisable that at an inertial positioning and motion system, such as the Applanix POS MV, be used. An inertial system should provide some provide good positioning in areas of sporadic problems, as well as allowing survey under overhead obstacles such as power lines or bridges. 8.6 Running Survey Lines A Bathyswath survey usually consists of a number of separate ‘survey lines’. To cover a rectangular area, a set of overlapping parallel lines is run over it. See section 4 for advice on planning the spacing between these lines. Create a separate raw data file for each survey line. Record all line names, settings, etc in the survey log. Attitude sensors work best in straight lines and are less accurate in turns. Therefore, try to ensure that lines are straight, or have very gentle curves. Use gentle line-keeping to keep the vessel on track. It is better to accept a few metres off-track error than to have a line with many short, sharp turns in it. Issue 4.2 July 2013 Page 8-9 Bathyswath Getting Started Using Bathyswath for Surveying Allow about 30 seconds straight run before the start of lines and after the end. This is about 60 metres at 4 knots. This practice allows the attitude sensor to settle down after the turns, and improves filtering and interpolation of position data at the start and end of the lines. It also allows the helmsman to get settled in to running a straight line after turning in to the start point. On long surveys, such as pipeline or cable routes, try to break the survey up into manageable lengths; say 5 to 10 km. Record separate data files for each section. This greatly aids postprocessing. Best results are also achieved with straight, rather than curved or dog- legged lines. Run the survey lines so that adjacent lines run in opposite directions. This ensures that port overlaps with port, and starboard with starboard. This pattern can be achieved by running the lines alternately, or by skipping two lines each time. The latter pattern is useful as it reduces turning time. For example, if the lines are numbered 1,2,3,4,5,6,7 ..., they may be run in the order 1,4,7,2,5 etc. Create a convention for naming lines, and stick to it. Do not re-use line names. If it is necessary to re-run a line, use a different name. For example, if ‘Line12’ needs to be re-run, call the new line ‘Line12A’. You may find it helpful to use a naming convention that tells you something about the line. Examples of this are distance from the centre-line, and the direction that the line is run. So ‘line30E’ is a line 30 metres from the centre line, run in an easterly direction. Use the same line naming convention across the survey spread. For example, if lines have been planned in a navigation program and given names, use those in the Swath program. One or more cross-lines running at right angles to the other lines helps with quality control, and can be very useful where, for example, lines disagree where they overlap due to tide errors. See section 8.2. 8.6.1 End of Survey Areas Before leaving each survey area, use the Coverage View to ensure that sufficient coverage has been achieved. The sonar range can be trimmed on this display to reflect the range for which data quality is deemed acceptable. Re-run any lines that are considered to be sub-standard, and fill any gaps seen on the coverage plot. Use data replay facility to check that all the data necessary has been gathered, and run a representative sample of the data through the post-processing system before leaving the survey area. Use estimated tide data if necessary. Repeat the pre-survey calibration measurements if these are likely to have changed; see section 8.1. Issue 4.2 July 2013 Page 8-10 Bathyswath Getting Started Section 9 Post Processing Software 9 Post Processing Software Post-processing converts the data acquired in real-time by Bathyswath into digital depth models. These depth models are used to produce displays and plots of the surveyed area. Users may select to use Bathyswatg post-processing software, or a third-party program, to suit their application. The post-processing program is called the Grid Processor (Gridproc). The stages involved in processing Bathyswath data include: Re-process the raw data (sxr) files collected during the survey to produces processed timeseries data files (sxp). Use the Grid Processor (Gridproc) to create gridded digital terrain model (DTM), or ‘grid’ files, (sxg) from the sxp files. Use third party tools to service the end use of the Bathyswath data: for example, charting packages to create charts, engineering packages volumetric packages, etc. The Bathyswath software is described in section 3.6. Issue 4.2 July 2013 Page 9-1 Bathyswath Getting Started Section 10 Maintenance 10 Maintenance Bathyswath is very simple and robust, and needs very little regular maintenance. However, the following instructions should help to keep a Bathyswath system accurate and operational. 10.1 Daily, and Before Leaving Port 10.1.1 Safety check Inspect all components of the system for safety, including: Personal safety: Ensure that all electrical supplies are intact and undamaged Ensure that the insulation of all cables is intact Ensure that all cables are properly fixed down and do not present a trip hazard Ensure that all off-board equipment, including transducer mounting arrangements, is properly and firmly fixed Ensure that there is a safety plan for the vessel being used and that all personnel understand it: this is outside the scope of this manual, but nonetheless literally vitally important. Refer to the safety advice in section 1 of this manual. Equipment safety: Ensure that all equipment is firmly fixed down. It may not be at risk of tipping over when in dock, but consider the effect of a rolling ship on every item. 10.1.2 Functional check Issue 4.2 Before leaving port, start up the system and check that profiles can be seen of the dock floor, however short. Ensure that the range and slope of the profiles that you can see are consistent with the arrangement of the boat with respect to the dock. Check the space remaining on the computer disk for sonar data. See section 4.6 for guidance on the rate of media use. If there is not enough space for the survey task, clear some space out by copying data to removable media, such as DVD, and then deleting. If the transducers are out of the water, do a ‘rub test’. Rub the face of each transducer in turn with your hand, and look at the signal level in the Amplitude display. Check that the level rises on the transducer you expect it to (port or starboard). A common source of confusion is to plug the transducers into the wrong TEM. Tip: use red and green electrician’s tape on the port and starboard (respectively) transducer connectors and TEMs. Check that the attitude, position and compass system outputs are consistent with what you expect for the current orientation of the boat. If there is to be a long transit out to the survey area, run up the sonar system as soon as the boat leaves the dock, and make sure that the seabed profiles are consistent with the local area. For example, when operating alongside, check that the dockside appears on the side that you expect. Make sure that the profiles do not move up and down as the boat rolls. This could be caused by: July 2013 Page 10-1 Bathyswath Getting Started Section 10 Maintenance o o The transducers being plugged into the wrong side The attitude sensor being mounted the wrong way around, or configured so that it ‘thinks’ it is pointing the wrong way. o System timing errors (see §6). As soon as possible, record and process a small amount of raw data, to make sure that the post-processing process is valid. 10.2 Weekly, and Before Each Survey 10.2.1 Calibrate the TEMs The transducer electronics modules (TEMs) measure the phase differences of the incoming sonar signals, comparing each one against an accurate clock signal. The electronics is set up in the factory so that two identical signals measured in difference TEM channels gives zero phase. However, all electronics can drift over time, and this drift needs to be accounted for in a calibration process. Rather than having to return the TEMs to a workshop to be set up, a simple procedure, run from the main Bathyswath software, can measure and account for any phase offsets in the TEM electronics. The calibration procedure is as follows: 1. Power up the system, including the TEMs, and allow at least 15 minutes for operating temperature to stabilise. 2. Make sure that the Bathyswath transducers are plugged in. If these are not available, use the Bathyswath TEM Calibration Box or a TEM transducer-shorting plug: contact Bathyswath if required. Calibrating a TEM with its input open-circuit will result in calibration values that are incorrect for survey use. 3. Start the Bathyswath software. 4. TEMs produced before October 2006 need a special Calibration Box, supplied with the Bathyswath system. Newer TEMs provide their own calibration signal when in ‘Calibrate’ mode, and so do not need the Calibration Box. For the older TEMs: a. Insert the Calibration Box’s connector into the top TEM connector (known as channel 1 or port channel) in lieu of the transducer cable. b. On the calibration box, select the correct frequency for the TEM to be calibrated. c. Switch on the calibration box. 5. In the Bathyswath Software, under ‘Input’ click on the ‘Sonar’ button. 6. Then select check ‘Active’, and ‘Calibrate’ and click on ‘Apply’ 7. Under the ‘Tools’ menu, enter the ‘Phase Offsets’ window 8. From the drop down list select ‘Transducer 1’ 9. Allow the displayed offset values to stabilize, could be 30 seconds or more) and check the ‘Apply Offsets’ box. 10. Click the Apply button. 11. For your records make a note of the phase calibration offsets derived. 12. Save the ‘session file’ (.sxs). This file should be used as the basis of all future ‘session files’ as it contains the phase offset calibration values. 13. In the ‘Sonar’ window, deselect ‘Calibrate’ and click ‘Apply’ 14. Turn off the calibration box (if used) and transfer it to the lower TEM connector. Issue 4.2 July 2013 Page 10-2 Bathyswath Getting Started Section 10 Maintenance 15. Repeat steps 7 through 15, substituting Transducer 2 for Transducer 1 16. Make sure that the calibration values recorded are used in every session file that uses these TEMs, even for post-processing. 10.2.2 Connector checks Check the state of all cables and connectors. Loose or damaged cables and connectors are probably the most common source of system problems. Check the state of sea-earth cables. These are often implemented with bare wire at the sea end, and can therefore corrode quickly. This corrosion can occur for a significant length of the wire, so it is often necessary to replace the whole wire. Try to find a way of keeping seawater out of the wire. 10.2.3 System checks A set of system checks is suggested under ‘Testing’ in the on-line help. 10.2.4 Computing system checks As with any computing system, a regular check of the system helps to keep the computer running efficiently and effectively. This includes: cleaning out old data, performing backups of essential software and data, 10.2.5 Patch-test calibration Run a calibration patch-test survey at the start of every survey, whenever the sonar transducers or attitude sensor are moved, and at regular intervals throughout long survey campaigns. See section 8.2. 10.3 Monthly, (or less often, depending on conditions) 10.3.1 Inspect transducers for marine growth Marine growth on the surface of transducers will severely reduce their effectiveness. All such marine growth should be removed as gently as possible: do not use sharp tools or mechanical grinders; otherwise, the transducer face can be damaged. 10.3.2 Corrosion check Check all items for corrosion. Fit sacrificial anodes, inspect them at regular intervals, and replace them if necessary. Such anodes can be obtained from any chandler’s. 10.3.3 Cleaning Clean the computing and electronics systems: Use a damp cloth, no solvents. Do not use tissue paper to clean the display screens. Display screens: use a soft cloth lightly moistened with a mild detergent solvent, then wipe clean with a soft dry cloth. Casing: wipe over with a soft cloth lightly moistened with a mild detergent solvent. 10.4 Yearly 10.4.1 Transducer capacitance check A check of the transducer capacitance, using a simple hand-held multimeter, can give an indication of problems with transducers or their cables and connectors, before such problems are noticeable in the sonar results. Measure the capacitance between each pair (A+, A- etc) and between the members of the pairs and their screens (A+ - A screen, etc), and note them down in a system logbook. The receive staves (A, B, C and D) should have similar capacitances, and the two transmit staves (Tx) should have similar capacitance. When these measurements are repeated at the next check period, look for any significant changes. Issue 4.2 July 2013 Page 10-3 Bathyswath Getting Started Section 10 Maintenance See section 10.6 for the transducer connector layout. 10.5 Transducer Checks After two years, and then every five years, it is advisable to check the aging of the active ceramic components in the transducers. This is done by returning the transducers to Bathyswath, who will arrange for a subset of the transducer calibration tests to be performed. The results from these tests are compared with those performed after manufacture. This will indicate whether there is any degradation in the transducer performance. 10.6 Transducer Connector Diagrams Details of the connector at the TIU and the connector on the transducer’s one-metre tail are shown below. 10.6.1 TIU Transducer connector The wiring of the Bathyswath transducer connectors in the standard TIU is shown in Figure 10-1. Bathyswath-SPLASH uses a different connector: refer to the Bathyswath-SPLASH supplementary manual. TIU: Pin letter on 26way Connector Function Description B + Stave A A - Stave A R SCREEN Stave A P + Stave B N - Stave B M SCREEN Stave B L + Stave C K - Stave C J SCREEN Stave C H + Stave D G - Stave D F SCREEN Stave D E + TX D - TX C SCREEN TX The different transducer frequency versions are encoded in pins W, X, Y, c and b. These codes are implemented in the transducer connectors as follows: Issue 4.2 Transducer Implementation 117 Pins W Y and b linked together 234 Pins X c and b linked together 468 Pins c and b linked together July 2013 Page 10-4 Bathyswath Getting Started Section 10 Maintenance Stave A - Sc + A + R Stave B Sc B P T X C T S - a N Sc U b Z M V c E + W Y F L + D X G K Stave C J H Stave D - Sc + Transducer Select Lines Figure 10-1 TIU Transducer Connector Layout Issue 4.2 July 2013 Page 10-5 Bathyswath Getting Started Section 10 Maintenance 10.6.2 Transducer Connector On the transducer 1-metre tail, the connections are as follows: Pin number on 16-way con Function Description Colour 15 + Stave A White 14 - Stave A Blue 4 SCREEN Stave A N/A 13 + Stave B White 12 - Stave B Orange 3 SCREEN Stave B N/A 10 + Stave C White 9 - Stave C Yellow 2 SCREEN Stave C N/A 8 + Stave D White 7 - Stave D Green 1 SCREEN Stave D N/A 6 + TX White 16 - TX Red 5 SCREEN TX N/A 11 Overall Screen Overall Screen N/A 6 +ve -v e 16 7 Transmit -ve +ve Stave 15 5 Screen Stave A Stave D 1 +ve 3 2 -ve +ve 13 Screen Screen 9 -ve Screen Scree n 8 14 4 StaveC Stave B 12 -ve +ve 10 11 View Issue 4.2 July 2013 Page 10-6 Bathyswath Getting Started Section 11 Specifications 11 Specifications 11.1 Summary Bathyswath is a low cost, high performance bathymetry and sidescan system suitable for installation on dedicated vessels, ships of opportunity, and remote platforms, including UUVs and USVs. It is simple to integrate into a full survey suite. It is intended for mapping the bottom of the sea and inland waterways. The transducers are mounted on pole, hull or underwater platform, and can be used to survey up to about 350 metres water depth (or altitude, for an underwater platform). The end products of the system are images and charts of the depth and strength of reflection of the seabed. These products are known as bathymetry and sidescan respectively. Bathyswath is available in three frequency versions, 117kHz for up to 350m depth (altitude), 234kHz for up to 150m depth and 468kHz for up to 75m depth. The system accuracy of all versions exceeds the latest IHO specifications, as set out in IHO Standards for Hydrographic Surveys, Special Publication 44, 5th Edition, February 2008. Operating in Microsoft Windows Vista or Windows XP, and with full on line help and manual, the system is easy to operate and extremely robust. Data acquisition mode stores all raw data output from the transducers while the real time displays allow processing and/or QA. A coverage plot assists in survey line planning. Data processing abilities include swath generation with speed of sound profile correction, swath gridding and fairsheet plots. Final data sets consist of correct positional x,y,z & a (amplitude) data. These xyza DTMs can be interrogated, viewed, exchanged and printed by the Bathyswath software and third party charting and DTM display software. Processing may be carried out on the survey workstation or another PC running Windows Vista or XP. 11.2 Power Requirements Bathyswath requires clean electrical power either of 110-240 Volts, at around 0.3kVA (for desktop and industrial computer systems), or 12-25V DC, at around 200W total and 20W for remote systems. The DC power version of the TIU is supplied together with a mains converter unit, for optional use with mains power. Bathyswath TIU Parameter Supply Voltage Value 110 -230Vac (50/60Hz) 12 – 25Vdc Supply Current AC 0.5A typical Supply Current DC 2.5A at 12V max 1.5A at 24V max Power Supply Fuse Issue 4.2 3A 250V slow-blow type July 2013 Page 11-1 Bathyswath Getting Started Section 11 Specifications 11.3 System Performance Bathyswath Technical Specifications Parameter Bathyswath-L Bathyswath-M Bathyswath-H 117 kHz 234 kHz 468 kHz Maximum Water Depth 350 m 200 m 80 m Recommended Working Depth 300 m 100 m 50 m Across Track Resolution 5 cm 2 cm 1 cm Azimuth Beam Width (two way) 0.85° 0.55° 0.55° Transmit Pulse Length 17µs to 1 ms 8.5µs to 500µs 4.3µs to 250µs Transducer Dimensions 235 x550 x90mm 160 x350 x60mm 100 x215x42mm Transducer weight in air 13 kg 6kg 1kg Transducer weight in water 1.6kg 0.9kg 0.1kg Total cable length 20 m 20 m 15 m Sonar Frequency Transducer interface unit dimensions 125 x 294 x 285mm Transducer interface unit weight 6.4 kg 11.4 System Weights Packing Case Contents Weight 1 Bathyswath TIU and Laptop 2 Transducers and Cables 3 Bow-mount kit Up to 25kg Up to 55kg (depending upon number and type of transducers) Up to 66kg (depending upon number and type of transducers) 11.5 Transducer Dimensions Item Height /mm Width /mm Depth /mm Weight in air /kg Weight in water /kg Transducer 117 kHz 235 550 90 13 1.6 Transducer 234 kHz 160 350 60 6 0.9 Transducer 468 kHz 100 215 42 1 1 1 0.1 2 Approximate weight: the length of cable used predominates if more than a few centimetres. Issue 4.2 July 2013 Page 11-2 Bathyswath Getting Started Section 11 Specifications Bathyswath transducers are fitted with a 1m cable “tail”, and an extension cable. For the 117kHz and 234kHz options, the transducer standard extension cable length is 20m; the maximum recommended is 35m. The 468kHz transducers are supplied with 15m cables, and should not be extended. Cable diameter is 13mm. 50 0. 9 0 0. 1 6 1 .0 M A R K T' O P O ' N TO P F A C E . 1 5 .0 4 9 2 .0 1 0ø 1 9 5 0. 2 3 5 0. 1 1 00 CO N N E C TO R O R 1 6 M E T R E S O F T .S P . A S R EQ U R I ED . 6 5 2 2 .0 5 5 0 .0 C H AM F E R BO T TO M CO R N E R O N LY . Figure 11-1 117kHz transducer dimensions The cable exit point is: Horizontal: Vertical: 2 161mm from the right-hand edge, viewed from the front of the transducer 117.5mm from both the top and bottom edges: i.e., on the horizontal centreline. Almost negligible, again, cables and connectors predominate Issue 4.2 July 2013 Page 11-3 Bathyswath Getting Started Section 11 Specifications 85 45 60 5 T .S P . C A B LE 1 3ø P U 160 1 3 0 0. 302 302 F IX N I G FO R M 8 BO LT S 350 42.0 Figure 11-2 234kHz transducer dimensions R25 CounterBore 4 places D10.5 x 16appx 215 4 off MTG D7 through 100.0 78.0 194 Figure 11-3 468kHz transducer dimensions Issue 4.2 July 2013 Page 11-4 Bathyswath Getting Started Section 11 Specifications 11.6 Transducer Frame Dimensions Bathyswath transducers can be supplied mounted on a ‘V’-bracket. The dimensions of the bracket assemblies, fitted with transducers, are as follows. Item Height /mm Width /mm Depth /mm Fits Through Hole Diameter /mm 117 kHz assembly 249 411 550 687 234 kHz assembly 169 284 350 451 468 kHz assembly 110 200 215 294 Issue 4.2 July 2013 Page 11-5 Bathyswath Getting Started Section 11 Specifications Figure 11-4 234kHz V-Bracket dimensions Figure 11-5 117kHz V-Bracket dimensions Issue 4.2 July 2013 Page 11-6 Bathyswath Getting Started Section 12 Reference 12 Reference 12.1 Glossary Issue 4.2 PPS A system of electronic pulses for synchronising subsystem clocks 3D Three-dimensional AGDS Acoustic Ground Discrimination System: a system that uses data from an echosounder to determine the type of the seabed ASCII A common computer format for human-readable text data Attitude The angular orientation of the system AUV Autonomous underwater vehicle Bathymetry Measuring depth Bathyswath-H High-frequency Bathyswath variant, working at 468kHz Bathyswath-L Low-frequency Bathyswath variant, working at 117kHz Bathyswath-M Medium-frequency Bathyswath variant, working at 234kHz Beam-former A sonar system that generates discrete beams of angular measurement to the seabed. Synonymous with ‘multibeam’. CAD Computer-aided design: computer software drawing packages CD Compact disk Chart datum A nationally or internationally agreed baseline for height measurement COTS Commercial-off-the-shelf: i.e., bought from a shop, rather than specially built for a one-off job DC Direct current DGPS Differential GPS: improves the accuracy of basic GPS by comparing the position obtained by a GPS system with that obtained at a fixed GPS station at a known location DTM Digital Terrain Model: a digital ‘map’ of the seabed, where depth and sidescan data are stored with reference to their geographical position DVD Digital versatile disk EMC Electromagnetic compatibility: robustness to external electrical ‘noise’ signals, and limiting transmission of such unwanted signals Ethernet A commonly used method for connecting computers together in local networks FPGA Field Programmable Gate Array: a digital electronic logic chip that can be programmed to carry out a set of tasks GMT Greenwich Mean Time; time zone; the Bathyswath software works in GMT GPS Global Positioning System: the most commonly-used satellite positioning system Grazing angle The angle that a sound ‘beam’ makes with the seabed July 2013 Page 12-1 Bathyswath Getting Started Section 12 Reference Issue 4.2 Grid file The file used by the Grid Processor application to store its data. Uses an ‘.sxg’ file extension. Gridproc The Grid Processor application Horizontal range The maximum reach of the sonar, measured horizontally along the seabed; compare with ‘Slant range’ Hydrography Measurement of physical characteristics of waters; commonly used to refer to those measurements and descriptions of navigable waters necessary for safe navigation of vessels Interferometer A sonar system that measures depths by comparing the phase of the signal received on a set of vertically-separated transducer staves. Also called ‘Phase Differencing Bathymetric System’ (PDBS) Inverter A unit that provides mains (120 or 240V AC) power supply from a DC supply, usually from a battery Line spacing The distance between survey lines run across the seabed LVC Line Voltage Conditioner: a unit that ‘cleans’ a power supply, to reduce the effects of ‘noise’ or possibly damaging ‘spikes’ in the supply Multibeam See ‘Beam-former’ NMEA National Marine Electronics Association; the NMEA 0183 format is commonly used to send data from marine electronics equipment such as compasses and positioning systems Noise Unwanted signal NTP Network Time Protocol: a method for synchronising computer clocks over a network Online help The electronic user manual that is accessed directly from the Swath software Patch test A method used to calibrate the relative locations and angles of the components of a survey system, by comparing depth results from overlapping survey runs PC Personal Computer PC Clock Recording the time of a data sample using the time of the computer’s clock at the instant the sample is received in the software. Compare with ‘Sensor Clock’ PDBS Phase Differencing Bathymetric System; see ‘Interferometer’ Ping A complete transmit-receive cycle, measuring depth and sidescan information over a profile of the seabed. Also sometimes used to refer to just the transmitted acoustic signal. Postprocessing Processing sonar data after it has been collected; compare with ‘real time’ PRF Ping (or pulse) repetition frequency: the number of pings emitted per second Profile A 2D set of depth measurements, usually taken sideways from a survey vessel PSU Power Supply Unit QA Quality assessment July 2013 Page 12-2 Bathyswath Getting Started Section 12 Reference Issue 4.2 Raw data file The file used by the Swath Processor application to store raw data. Uses an ‘.sxr’ file extension. Real time Data processing at the same time as data is collected; compare with ‘Post-processing’ RF Radio frequency RIB Rigid inflatable boat ROV Remotely-operated vehicle; an unmanned underwater vehicle that is connected to a surface vessel by a cable and controlled by a human operator RS232 A commonly-used format for serial data connections RTK Real-time kinematic GPS: an accurate form of GPS measurement Sensor Clock Recording the time of a data sample using a clock maintained inside the sensor itself. Compare with ‘PC Clock’ Session file The file used by the Swath Processor application to store its settings. Uses a ‘.sxs’ file extension. Sidescan Images of the seabed using the amplitude (strength) of the acoustic returns from the seabed. These are usually represented as grey pixels in a ‘waterfall’ display on the screen, with the brightness of pixels representing the strength of the signal. Slant range The maximum reach of the sonar, measured in a direct line from the sonar transducers to the seabed; compare with ‘Horizontal range’ Spreading loss Reduction of the amplitude of the sonar signal as it passes through the water Squat Change in height of a vessel in the water as the vessel moves Survey line An area of the seabed is usually surveyed by running a series of parallel straight lines across it Swath The Swath Processor application swath A ‘ribbon’ of seabed depth measurements, made up of a series of ‘profile’ measurements of depth as the sonar is moved forwards over the seabed SWATHplus Previous versions of the Bathyswath sonar were called “SWATHplus” Swathsounding Measuring the depth in a line extending outwards from the sonar transducer, then moving forwards to build up swaths TCP/IP A data format used to transfer data over Ethernet. UDP is another type. TCP/IP is a more reliable protocol, but is slightly slower. TEM Transducer Electronics Module: provides the input and output electronics for one sonar transducer Third-party software Software that is produced by organisations other than Bathyswath or its clients TIU Transducer Interface Unit: the blue box containg the TEMs Transducer The component that is placed in the water and converts sound energy into electrical signals and vice versa TVG Time-varying gain: an adaptable gain correction applied to sidescan data to remove the gross changes in amplitude caused by range and transducer beam shape, leaving an image of the seabed itself July 2013 Page 12-3 Bathyswath Getting Started Section 12 Reference UDP User Datagram Protocol; see ‘TCP/IP’ UPS Uninterruptible Power Supply: a power supply that maintains a mains power supply from battery if the mains supply (e.g. from a generator) fails USB Universal Serial Bus. A common computer peripheral interface. USV Unmanned surface vehicle UTC Coordinated Universal Time; a time zone, equivalent to GMT UTM Universal Transverse Mercator: a commonly-used format for representing latitude and longitude positions in a plane representation as Easting and Northing UUV Unmanned underwater vehicle; usually synonymous with AUV V-bracket The V-shaped mechanical assembly that holds a pair of transducers XTF An industry-standard data format, commonly used for sidescan data. These files use a ‘.xtf’ file extension. xyz A position in three-dimensional space xyza Three dimensional position plus amplitude ZDA An NMEA 0813 protocol message that is used with PPS signals to synchronise subsystem clocks 12.2 Bathyswath Web Page Latest information on Bathyswath and related products can be found on the Bathyswath web page: www.bathyswath.com 12.3 Bathyswath Support Technical support is available from Bathyswath. Time-limited support may be provided with the sale, after which yearly support packages can be purchased. A convenient route to support is to email support@bathyswath.com Issue 4.2 July 2013 Page 12-4