1
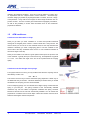
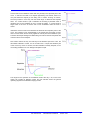
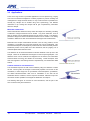
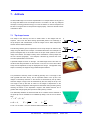
The mass of a cantilever strongly influences its resonant frequency and spring
constant. A light cantilever with a high spring constant will have high resonant
frequency. The higher the resonance frequency, the better the high speed
response of the cantilever in air.
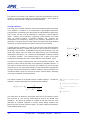
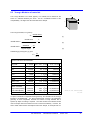
Res. Freq.
f =
1
k
2π
m
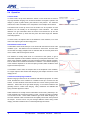
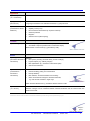
For intermittent contact mode in liquid, the capillary force is not a problem, and
softer cantilevers are often used. “Contact mode” cantilevers are often used for
intermittent contact mode in liquid conditions. The resonant frequencies are much
lower, and the damping of the liquid around the cantilever has a strong effect on
the resonance. The resonance of typical soft cantilevers in liquid is usually a few
kilohertz, but in fact the cantilever is often driven at a resonance of the liquid cell or
acoustic cavity in this frequency range rather than the actual cantilever resonance.
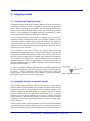
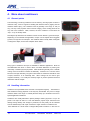
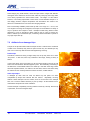
The spring constant of a cantilever can be estimated from its geometry and the
properties of the material it is made from. The spring constant depends very
strongly on the thickness of the cantilever, however, and this can be difficult to
measure accurately. If a calibrated reference cantilever is available, then the
cantilevers can be pushed against one another to compare the deflection of one
cantilever by the other. For soft cantilevers another option is to measure the
thermal noise and calculate the spring constant. This is an attractive option, since
the cantilever is not damaged by the measurement, and no extra equipment is
required. These methods are discussed further in Section 4.5
2.5 Phase imaging
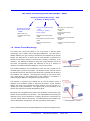
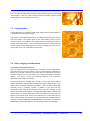
During an AFM experiment in intermittent contact mode the cantilever is driven at
some frequency in the kilohertz range (a few kHz in liquid, or a few hundred kHz in
air typically). The whole cantilever vibrates with the same frequency, but depending
on the conditions of the tip and sample there will be some phase shift between the
drive signal and the cantilever movement measured by the lock-in-amplifier. This
phase shift can be measured and displayed in a phase image.
The phase signal is sensitive to properties of the tip-sample interaction, and may
show up mechanical information about the sample. Adhesion between the tip and
sample or other dissipation of the cantilever energy by a viscoelastic response of
the sample are two mechanisms that may cause a large phase shift of the
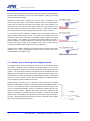
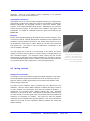
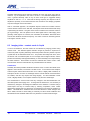
resonance. This means that sometimes in phase images two different components
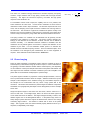
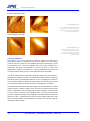
embedded on a topographically flat sample can be distinguished, as in the example
shown here.
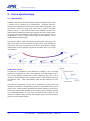
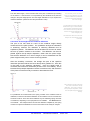
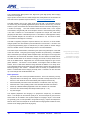
Height and phase images of the same area are shown, with the scale bar of 1
micron in each case. In the height image, there is an area in the lower right hand
corner where the texture is different. The height changes smoothly, however, and
different regions can not be distinguished within it. In the phase image, there is a
sharp change of phase shift at the edge of the textured area, and there is a sharply
contrasting region within it. This feature is marked with an arrow in the phase
image. This is typical of the case where material property differences show up in
the phase, independently of the height.
JPK Instruments
NanoWizard® Handbook
Version 2.2a
9