1
2 AsTrend - Operation
***
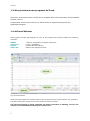
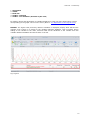
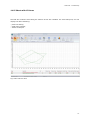
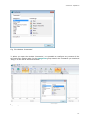
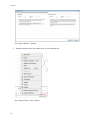
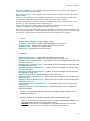
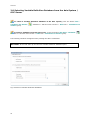
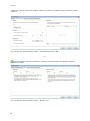
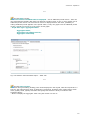
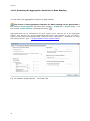
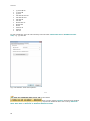
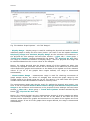
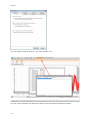
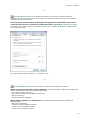
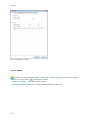
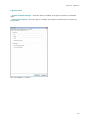
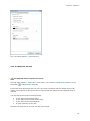
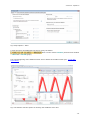
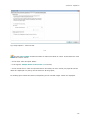
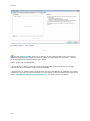
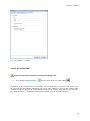
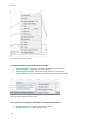
The tab Data includes:
- Period of Time from Which Data Is Displayed - use an additional period of time - then one
can simultaneously display data from two different periods of time; if one or more graphs use an
additional period of time: the second axis of time is displayed above the chart, possibility of
editing additional period appears in the period editor; if only one graph uses an additional period
of time, second axis of time is in the colour of this graph.
- Graph Data Type: Aggregated Data:
- Aggregate Name;
- Aggregate Calculating Interval;
- Aggregate Timestamp.
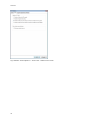
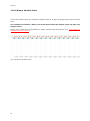
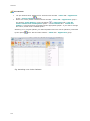
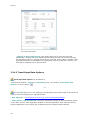
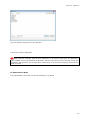
Fig. The Window 'Add Calculated Graph' - 'Data' Tab.
***
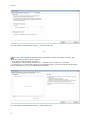
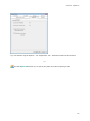
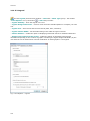
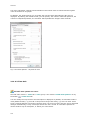
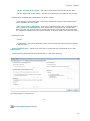
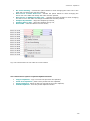
The tab Value Format:
- is used during formatting floating point values displayed in the legend, table and exported to a
text file; the option doesn't apply to attributes: Total Value, Gradient Value, Value Range, Delta
Value, Quality Good, Quality Uncertain and Quality Bad which are always rounded to four
significant digits;
- allows to display the aggregate 'total' using the format d h:mm:ss.
69