1
MacroView Navigator Manual
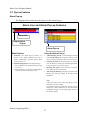
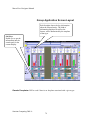
Dual Chart Trends
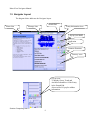
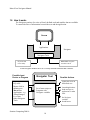
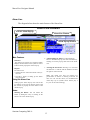
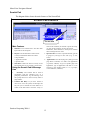
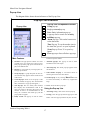
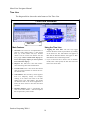
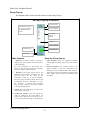
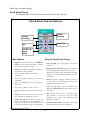
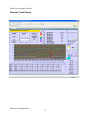
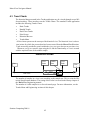
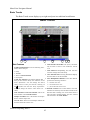
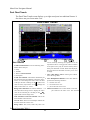
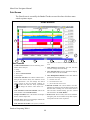
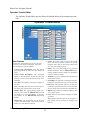
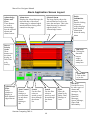
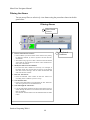
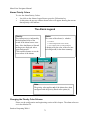
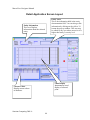
The Dual Chart Trends screen displays up to eight trend pens in a traditional format. It
also shows one pen for an entire view.
Dual Chart Trends
1
2
1
3
2 3
9
6
9
8
4
5
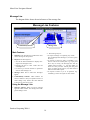
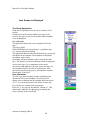
Main Features
7
5
8 8
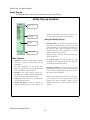
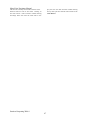
can be useful by allowing the operator to see an
important trend for a long period of time. Features
in the pen’s history may be used to identify where
other pens should be viewed. When first displayed,
the range chart will be blank. Choose a pen to view
its range.
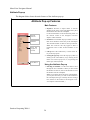
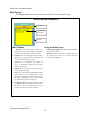
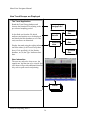
1 Trend Pen Information: Lists the following information about each pen:
• Entity
• Attribute
• Value at selected location
7 Turn OFF Range Chart: Pressing this button
• Description
clears the range chart.
2 Trend Pen Selection: The buttons labeled SP put
8 View Manipulation Buttons: These three buttons
the selected Entity and Attribute in the Entity Inforperform the following functions:
mation Area and change the chart’s scales to those
• < Go back one view
of the pen selected. Clicking on the
symbol will
• > Go forward one view
clear the Entity Information Area and change the
• >| Go to the most recent view
chart’s scales back to 0 - 100%.
3 Range Chart Selection: The buttons labeled 1 - 8 9 Selected Location: The vertical band or wire bar
pen’s data for the entire view. This functionality
cause the bottom range chart to display the entire
view for the selected pen. Clicking on the
symbol will clear the range chart.
4 Time and Date of Current Selection: This is the
time and date of the selection.
5 Current View: These two timestamps indicate the
start and end of the current view.
6 Range Chart: The (lower) chart may show one
Sentient Computing 2006 ©
46