1
Software
Show graphs
3.7.1
Graph options
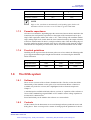
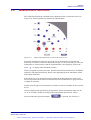
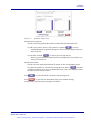
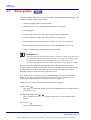
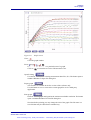
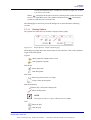
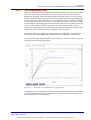
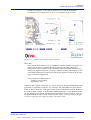
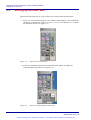
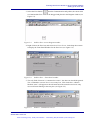
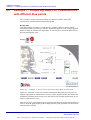
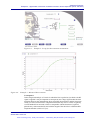
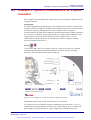
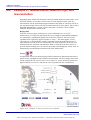
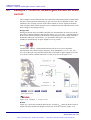
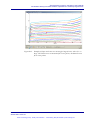
Click on this symbol to open the graph options dialog box where the data may be
manipulated and the graph display changed.
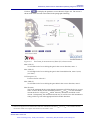
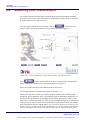
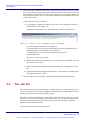
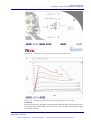
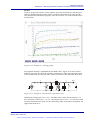
Figure 3-9:
Graph options dialog box
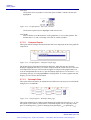
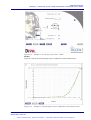
Text may be entered in the Comments box. When the graph is saved this comment will
be stored with the rest of the measurement data.
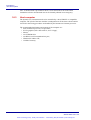
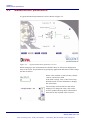
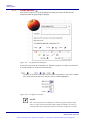
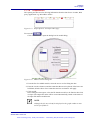
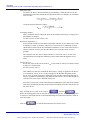
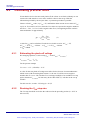
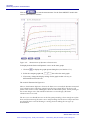
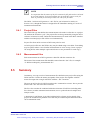
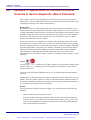
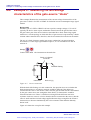
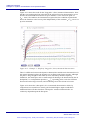
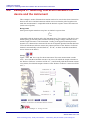
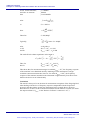
Clicking on the arrow at the side of an axis name will produce a list of the variables
that can be plotted on that axis, with the current variable highlighted.
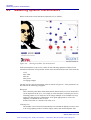
Figure 3-10: Graph axis selection
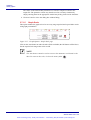
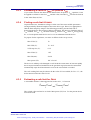
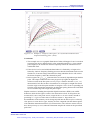
NOTE
The z-axis represents the variable for which the graph is plotted. This
choice is only relevant to measurements made on software version 3.0
onwards where all measurement data is stored in a single file. In older
3-10
DIVA User Manual
9DIVA-UM01 Issue 3.0
Artisan Technology Group - Quality Instrumentation ... Guaranteed | (888) 88-SOURCE | www.artisantg.com