1
Freescale Semiconductor, Inc.
P ro fi l i ng in Po w er Pl a nt
Profiling Your Code
NOTE
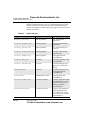
If you get an Assert_() message, it means the values you
provided for inNumFunctions and inStackDepth are too low.
You will need to re-profile your code using larger values.
Profiling Your Code
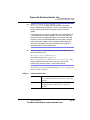
To profile your code, you do four things.
1.
Set up your project for profiling
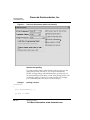
This step is very similar to the description given in the Profiler Guide.
The only changes are the source file you add to your project, and the
header file you add to your code. More detail on this is given in the
code exercise.
2.
Run a profiler on the area of the code you want tested.
This might be a single routine, a group of routines that perform a
task, or even the entire application. What you profile depends upon
what you are testing.
Declare a local StProfileSection variable, and provide the
proper setup information. Your declaration will look something like
this:
StProfileSection theProfile(“\pTest”, 50, 50);
All code that runs from that point on, until theProfile goes out of
scope, will be profiled.
3.
Analyze the data collected by the profiler and improve your code.
You study the results of your profiling and look for problems and
room for improvement. For details on how to review the results, see
“Viewing Results.”
The profiling process is iterative. You repeat steps 2 and 3 until you
achieve the performance gain you need to meet your goals.
4.
Run your code without the profiler
When you are satisfied that you have reached your goals, you have
one more step to perform. You should run your original tests—
without the profiler of course—to verify that your code in its natural
state meets your performance goals.
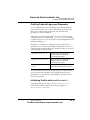
Implementing the above steps in your program is simple and only
requires two lines of code.
Profiler User Guide
For More Information: www.freescale.com
PFL–65