1
Post Processing
170
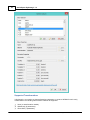
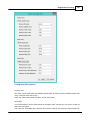
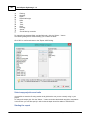
Sensor data channel 2;
Sensor data channel 3;
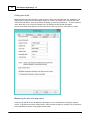
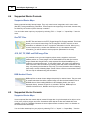
The sensor data channels can be used to store either magnetometer data, information on reflectivity,
bottom loss or duration of the returned echo(s).
The data that each channel contains can differ, and depends on the echosounder plugin that was used to
record the data.
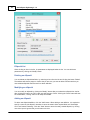
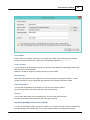
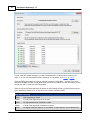
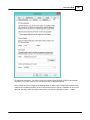
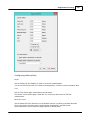
Matrix spacing
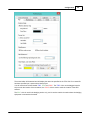
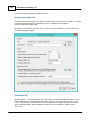
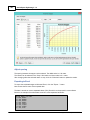
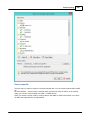
You can select the spacing of the regularly spaced data here. The same spacing is applied to both the X
and Y axis.
The spacing has to be entered in the same units as used for the map projection.
Which spacing to use depends on the zoom scale you are using. For an overview of a large area, you
can use 2.5 meter.
When zooming in on a smaller area, the best is to use values between 0.25 and 1.00 meter.
Please note that when using a larger spacing, it will be generated and displayed faster then a more
dense matrix.
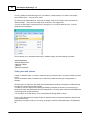
Clipping area
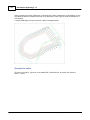
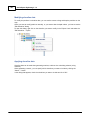
Use this to select which clipping area (boundary) has to be applied when generating the matrix. Only
data points within this area will be calculated.
This can be used in cases when only a part of the sounding areas has to be interpolated. When no
boundary is selected, the matrix is only clipped by the extends of the data points.
In addition to boundaries, you can also use shorelines to clip data along the shore, or to generate islands
(or holes).
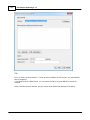
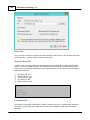
Output file name
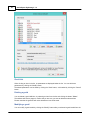
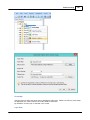
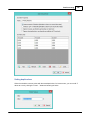
Enter the name of the file that is generated here. This setting is required.
You can enter a simple name (for instance the same name as the sounding used) here, which will be
stored in the default matrix folder.
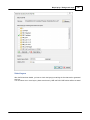
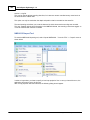
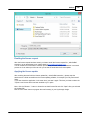
When you want to store the result elsewhere, use the browse button to select the output folder and file
name.
The data will be added to the current project and stored in a separate ASCII XYZ file at the desired
location.
Generating the matrix
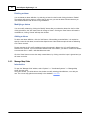
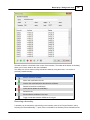
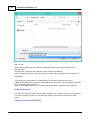
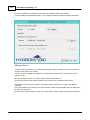
Finally, click the "OK" button to start the process. It should take a couple of second, you can watch the
progress in the status bar of the main window.
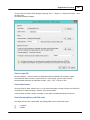
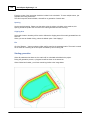
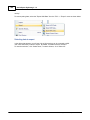
After generation, you will notice the matrix has been added to the project. Depending on the
configuration, the newly generated matrix will be drawn over the map.
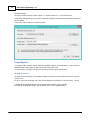
Displaying the matrix
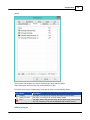
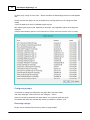
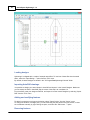
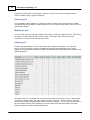
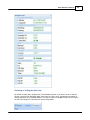
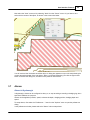
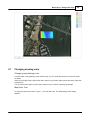
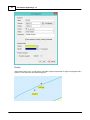
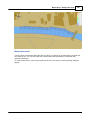
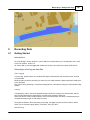
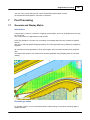
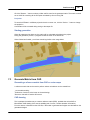
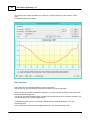
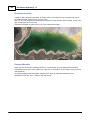
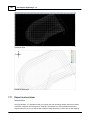
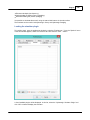
There are more ways of showing the matrix on the map. In the example near the top of this page, it is
displayed at both colors and text at a 5x5 meter interval.
(C) 2015 ActiveXperts Software B.V.