1
1
Using discrete distributions
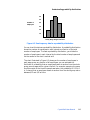
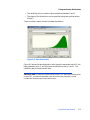
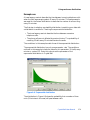
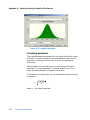
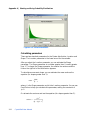
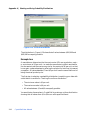
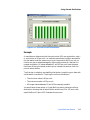
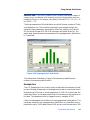
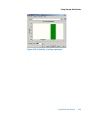
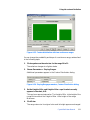
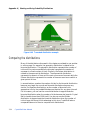
Figure A.26 Poisson distribution
The distribution illustrated in Figure A.26 shows the probability of observing
x number of defects in 100 square yards of the carbon fiber material.
Statistical Note: The size of the interval to which the rate applies, 100 square yards
in this example, has no bearing on the probability distribution; the rate is the only key
factor. If needed for modeling a situation, information on the size of the interval must be
encoded in your spreadsheet formulas.
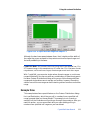
Example two
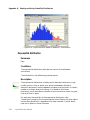
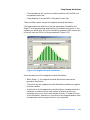
A travel agency wants to describe the number of calls it receives in 10 minutes.
The average number of calls in 10 minutes is about 35.
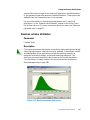
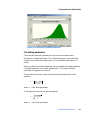
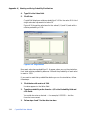
Again, you begin by identifying and entering the values to set the parameters
of the Poisson distribution in Crystal Ball. In this example, the conditions
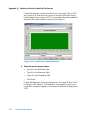
show one important value: 35 calls or a rate of 35. The result would be a
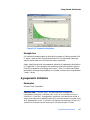
distribution showing the probability of receiving x number of calls in 10
minutes.
Crystal Ball User Manual
313