1
Iqsim-user manual v.2.0
2010.11.30
10 of 45
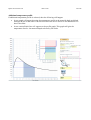
Evaluation and its consequences.
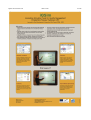
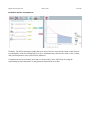
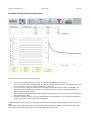
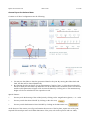
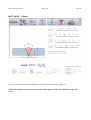
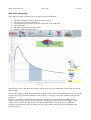
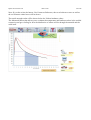
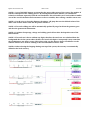
Example. The HAZ calculation graphs has been moved into the canvas and scaled so that the user
can manipulate with the welding data in order to simultaneously monitor the result on the cooling
time (and temperature curve) and Vickers hardness.
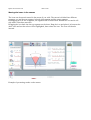
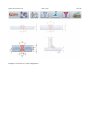
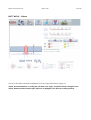
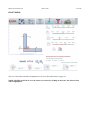
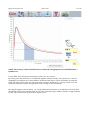
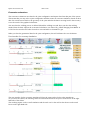
Comparisons can be performed, showing two items side by side, effectively showing the
relationship between alterations of the geometry data and the cost data.