1
570
Applications and Experiences of Quality Control
D1
D4
D3
D2
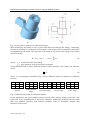
Screw end
Burr
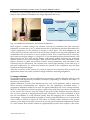
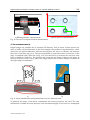
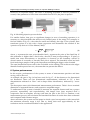
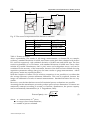
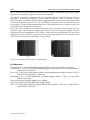
Fig. 17. The second component and the features to measure
D1
D2
D3
D4
Burr
Screw end
Nominal Dimension
14,00 mm
19,50 mm
4,80 mm
17,00 mm
Acceptable range
13,82÷14,18 mm
19,29÷19,71 mm
4,75÷4,90 mm
16,82÷17,18 mm
< 0,20 mm
< 1,00 mm
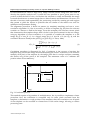
Table 1. Feature to inspect
About repeatability, the results of 100 image measurements, on feature D1 as example,
evidence a standard deviation of 0,0093 mm. Better results have been obtained with feature
D2 and D4, respectively with standard deviation of 0,0055 mm and 0,0033 mm. The best
result in repeatability is on D3 feature, with standard deviation of 0,0014 mm. These values
include all possible disturbances, that is pixel noise and realignment errors, and can be
considered as the accuracy of the instrument, because of the bias has been deleted choosing
acquisition parameter settings that gives the same results as gauge measurements. About
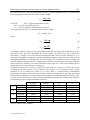
the process, results are reported in table 2.
With the exception of feature D3 (for which a comparison is not possible) it is evident that
the average measures present minimum differences. This can be expected, because the
image was calibrated on results of manual measurements. Standard deviation also are very
similar.
Moreover, once the data has been stored, all statistical process evaluations are possible.
Assuming that the manufacture processes produce pieces whose dimensions or features are
statistically scattered according to normal, or Gaussian, distributions, the process capacity
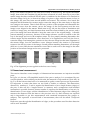
can be automatically determined as (A. V. Feigenbaum, 1983):
Process Capacity = 6σ =
where: u = measurement of int piece;
u = average value of measurements;
n = number of pieces evaluated.
www.intechopen.com
∑ ( u − u)
n− 1
2
(5)