1
150
Kruse et al.
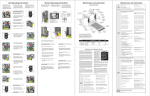
Figure 2. The initial view of the SIPS_Viewmain window using IDL widgets under Motif.
• saving the current image to a data file or
a color PostScript file
Image Display
Individual bands can be selected by entering the
band n u m b e r or wavelength, or by using slider
bars (Fig. 3). Grabbing and moving the slider
changes its value and thus the band displayed.
SIPS_View can display the current band as a
gray-scale or a density-sliced image, or display
three bands as an RGB color composite. Selecting
"Toggle Color On" on the pull-down Image Menu
causes S I P S V i e w to replace the single slider
used for selecting a single band number with
three sliders used for selecting a red, green, and
blue band number. Grabbing any of these sliders
and selecting a new band number to display in
that color causes SIPS_View to read and display
the new color composite image when the slider
is released. Selecting "density-slice" on the menu
provides an 18-color RGB ramp for a single image
where low brightness values are represented by
blacks and blues and high brightness values are
represented by reds and whites. Individual ranges