1
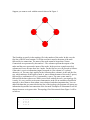
Example:
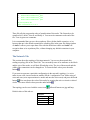
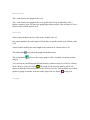
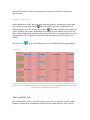
Figure 6. Scanning of configuration 0000000000000 until it reaches an attractor (1100110101100).
The Neighborhoods Tab
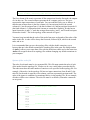
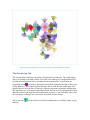
In this section you can perform an analysis of small perturbations to any configuration and
calculate the stability of an attractor or any other configuration. The input configuration can
be read in binary or decimal formats. After giving it, press the “Neighbors” button to start
de analysis. On the left panel the results will appear in text format. The analysis consists in
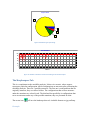
change the state of each node, one by one, and recon its destiny attractor. On the right you
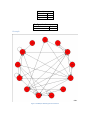
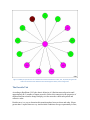
will find the results in a graphic form. The graph shows a central node which represents the
original configuration painted with the color of its attractor. The surrounding nodes
represent what happens if that node changes its state, if the destiny is the same, the color of
the node will be the same as the central node, and otherwise the color will be different. The
stability of the node will be calculated on the basis of small mutations at a Manhattan
distance equals to 1. A node with 100% of stability at that range of perturbation will show
all the nodes with the same color as the central node.
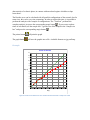
The sizes box controls the graphic style.
Names checkbox allows showing or hiding the labels of the nodes. Its default value is
checked.
Network control modifies the size of the entire graph. Its default value is 250.
Nodes control changes the size of all the nodes of the graph. Its default value is 50.