1
Chapter 3 Database Analysis
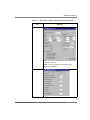
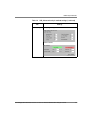
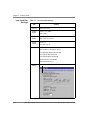
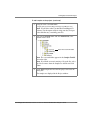
To examine the allelic ladder calls: (continued)
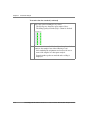
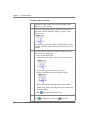
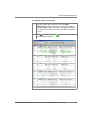
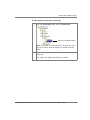
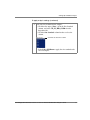
4. Verify that the allelic ladder is called correctly for each
marker.
Note: Deselecting Controls to Top will display all panes
chosen from Genotypes plots.
5. Close the Genotypes Plot window.
Examining Data
and Editing
Labels
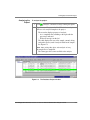
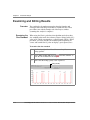
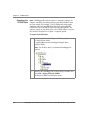
To examine data and edit labels:
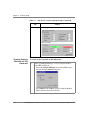
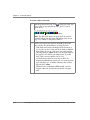
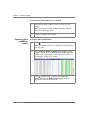
1. Click
(Low Quality to Top).
Note: This option can be set as a default in Analysis options
(see page 1-29).
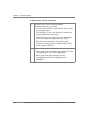
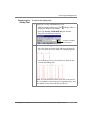
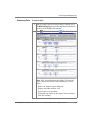
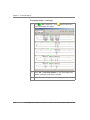
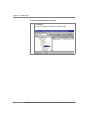
2. Select Sample5, Marker CSF1PO, which displays yellow
triangles (Check) in the Peak Height Ratio (PHR) and Allele
Number (AN) columns and a red octagon (Low Quality) in
the Genotype Quality (GQ) column.
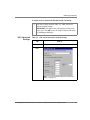
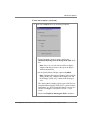
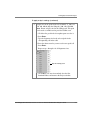
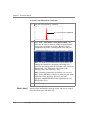
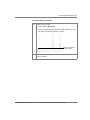
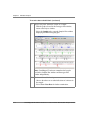
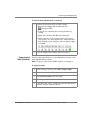
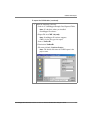
3. Click
(Display Plots) to open the Genotypes Plot
window and select the HID Genotyping plot from the
drop-down list below the menu bar.
3-10
GeneMapper® ID Software Versions 3.1 and 3.2 Human Identification Analysis Tutorial
DRAFT
October 15, 2004 4:48 pm, DatabaseFlow.fm