1
ATMOSYS User Manual
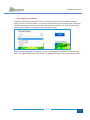
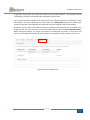
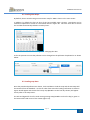
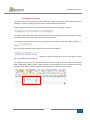
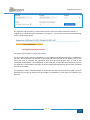
The speed can be altered using the Speed slider bar shown at the top left hand side of the map.
To scroll through the 335 ‘hourly views’ manually,one by one, use the fast forward and rewind
buttons.
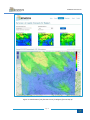
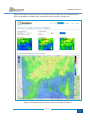
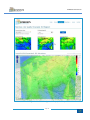
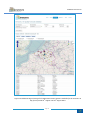
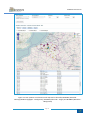
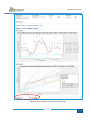
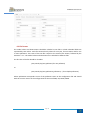
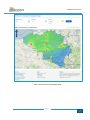
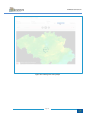
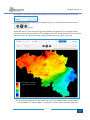
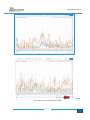
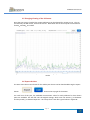
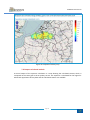
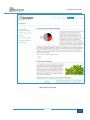
Hereunder the 211th 24h moving average map (19:00hrs on the 9th day, thus showing the 24h
average for the period starting at the 9th day 19:00 until the 10th day 18:00) for PM2.5 for the chosen
period is shown. The pollution episode is clearly visible in the north region of the map.
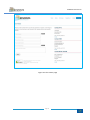
Figure 52: The 211th 24h moving average map (19:00hrs on the 9th day, thus showing the average
for the period starting at the 9th day 19:00 until the 10th day 18:00) for PM2.5 for the period 1st
January 2009 to 14th January 20019 - the episode is clearly visible in the north of the map
Page 70