1
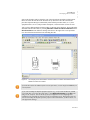
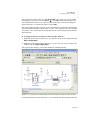
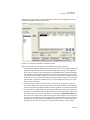
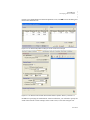
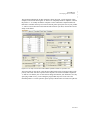
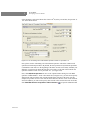
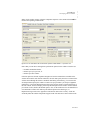
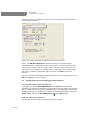
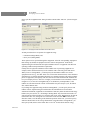
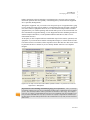
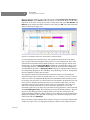
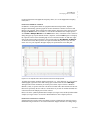
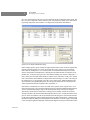
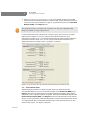
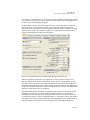
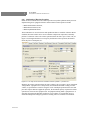
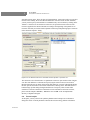
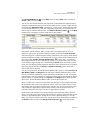
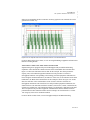
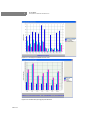
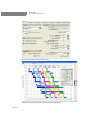
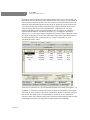
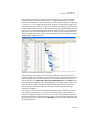
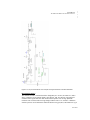
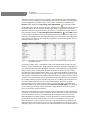
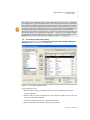
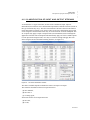
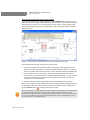
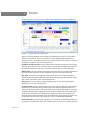
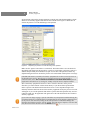
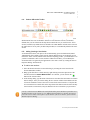
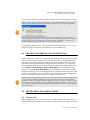
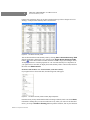
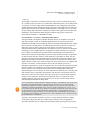
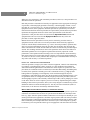
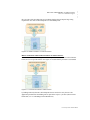
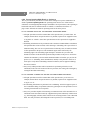
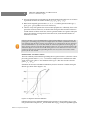
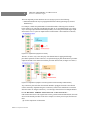
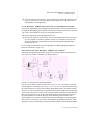
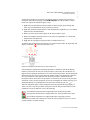
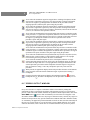
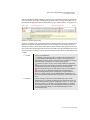
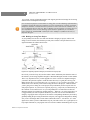
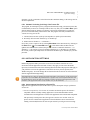
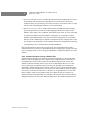
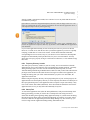
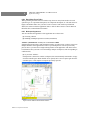
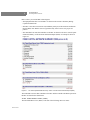
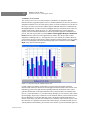
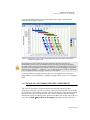
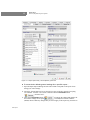
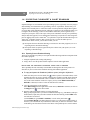
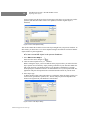
2 TU T O R I A L Developing a Process Model Please generate this chart for your example process by selecting Equipment Occupancy Multiple Batches on the Charts menu. By default, two batches are shown. To add more, right-click on the chart to bring up the chart’s context menu and select Set Number of Batches. Please change the number of batches to three and press OK. Your chart should look similar to that shown in Figure 2.32. Figure 2.32: The Equipment Occupancy Chart for three consecutive batches. For each equipment, the occupancy time by some operation is represented by a bar. White space represents idle time. Placing the mouse pointer over a bar will display the name of the operation that corresponds to that bar. Right-clicking on a bar will bring up its context menu. On this menu, you can click Operation Data to display the ‘Operation Data’ dialog for the corresponding operation, or Procedure Data to display the ‘Procedure Data’ dialog for the corresponding unit procedure, or Equipment Data to display the ‘Equipment Data’ dialog for the corresponding equipment. In the ‘Scheduling’ tab of that dialog, you can see, among others, the total equipment occupancy time per batch. The equipment with the least idle time between consecutive batches (or, equivalently, the longest occupancy time per batch) is considered the time (or scheduling) bottleneck (R-101 in this case). This is the equipment that determines the maximum number of batches per year. Its occupancy time per batch (10.75 hours in this case) corresponds to the minimum cycle time of the recipe (the minimum possible time between two consecutive batch starts). The total equipment occupancy time per batch (12 hours in this case) corresponds to the actual cycle time of the recipe (the actual time between two consecutive batch starts). To view this information, right-click on an empty area in the chart to bring up the chart’s context menu and check Scheduling Summary. This will display the ‘Recipe Scheduling Summary’ dialog for the process. That dialog presents (for display purposes only) the same information as the ‘Recipe Scheduling Information’ dialog of Figure 2.30. To change the style and contents of the Equipment Occupancy Chart, right-click on an empty area in the chart to bring up the chart’s context menu and select Edit Style. Please refer to the synthetic pharmaceutical example (see Figure 2.55) and the β-Galactosidase example (see Figure 2.63) to see Equipment Occupancy Charts for more complex processes. 2 -46 Tutorial