1
US 7,359,544 B2
5
6
known process operations have not been described in detail
in order not to unnecessarily obscure the present invention.
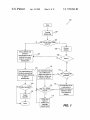
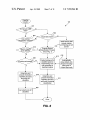
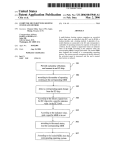
FIG. 1 is a ?owchart illustrating a procedure 100 for
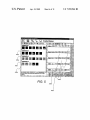
selecting a particular number, and a set of buttons for
selecting from a plurality of ?xed numbers. In the illustrated
embodiment, the total number of groups 302 is set to ?ve by
slider 302.
Representative defects from each group are presented to
the user. Viewing the representative defects, the user may
continue to adjust the total group number until he/she is
satis?ed that the presented defects are divided among a
correct number of groups. For example, when each group
has similar types of defects, the user may determine that
total group number is set correctly. Otherwise, when one or
more groups contain signi?cantly differing defect types, the
user may adjust the total group number. In the illustrated
increasing the e?iciency of manual classi?cation in setting
up a classi?cation system in accordance with one embodi
ment of the present invention. Initially, defect data is pro
vided in operation 101. Defect data is typically provided in
the form of images obtained from a high resolution review
tool, such as an electron microscope. One example of a
review tool is the eV300 E-beam Defect Review tool
available from KLA-Tencor of San Jose, Calif. Typically, a
semiconductor product, such as a product wafer or test wafer
(or a device), is inspected for defects and a defect map is
provided. The defect map is then used to obtain a high
example, group1 30411 has 10 representative defects having
resolution image of each located defect, e.g., using the
a similar appearance; group2 30419 has 9 representative
defects having a similar appearance; group3 3040 has 10
representative defects having a similar appearance; and
group4 304d has 8 representative defects having a similar
appearance (group5 is not visible and may be seen by
review tool.
After defect image data is provided, it may then be
determined whether there are any manual class codes
present in operation 102. In other words, it is determined
whether a user has already manually classi?ed a set of
defects. If there are no manual class codes, a manual
20
classi?cation procedure will then be initiated in combination
with an automatic process to increase the e?iciency of such
manual classi?cation procedure. In general terms, tech
niques are provided so as to help a user e?iciently classify
a manageable subset of defects. First, the defects may be
25
automatically grouped and a representative set of defects
from each group is presented to a user for classi?cation in
operation 104. However, this grouping operation is optional
and may be skipped. Alternatively, a representative set from
30
the whole defect set may be presented to the user for
classi?cation without ?rst grouping the defects into groups.
scrolling down).
The representative defects generally include a minimum
set of defects that require user classi?cation. For instance,
when there is a plurality of nearly identical defects within a
group, a single defect from this identical set is selected to be
included in the representative set for such group. Addition
ally, boundary defects or the most different defects within a
group are typically selected as part of the representative set.
Any suitable algorithm may be used to determine the
representative defects for each group presented to the user
for classi?cation. The algorithm is selected to present a
non-redundant and diverse set of defects for each group that
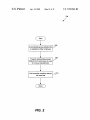
FIG. 2 is a ?owchart illustrating the operation 104 of FIG.
maximizes diversity (i.e., presents the most diverse set of
defects for each group). The representative set may also be
1 for grouping defects and presenting representative defects
selected to include defects which are uniformly distributed
from each group to a user for manual classi?cation in 35 among the group’s defects. In a speci?c implementation, the
accordance with embodiment of the present invention. Ini
tially, the defects are automatically grouped into a selected
number of groups in operation 202. In the illustrated
embodiment, the user may select the number of groups.
Alternatively, the number of groups may be pre-de?ned.
Representative or seed defects are then presented from each
following algorithm is used to select the representative set
40
group to the user for manual classi?cation in operation 204.
for each group:
(i) If the defect number for the group is less than 3, select
all defects from such group;
(ii) the maximum number of defects to be selected must
be less than 10 defects for the group;
(iii) select defects based on the following formula if
Any suitable grouping technique may be implemented to
condition (i) has not been met and (until condition (ii) has
group or cluster similar defects. Several grouping techniques
are further described in Us. Pat. No. 5,991,699 by Ashok V.
Kulkami et al. issued 23 Nov. 1999 and International Appli
cation No. PCT/USOO/ 32635 ?led 29 Nov. 2000 published 7
Jun. 2001, which are both incorporate herein by reference in
their entirety for all purposes.
In one example implementation, a natural grouping pro
cedure or algorithm may be implemented to group the
been reached or until 1A of the defects for such group has
45 been selected: max{min(dl, . . . dn)}for all defects n, where
d is the distance between a defect that has yet not been
selected as a representative defect and a representative
defect, (herein referred to as the “max/min algorithm”).
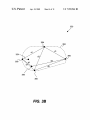
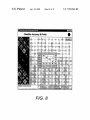
FIG. 3B illustrates the application of the max/min algo
50
defects into a selected or prede?ned number of groups. A
natural grouping algorithm typically includes ?rst obtaining
the defect that is located a farthest distance (in feature space)
a feature vector for each defect image. The feature vector
may include any suitable number and type of quanti?able
image characteristics, such as defect shape, defect siZe,
defect intensity, background intensity, etc. The feature vec
tors are then plotted in N-dimensional space (where N is the
number of vector parameters) and spatially clustered or
grouped based on each vectors relative position in such
space.
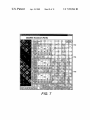
FIG. 3A is a screen shot showing a representative sets of
defects 304 from a selected number of groups (Groups 1~5
are shown). The user may select or adjust the total number
of groups by any suitable mechanism such as the illustrated
slide bar 302. Other common input device types include an
entry box for entering a speci?c number, a dial or knob for
rithm to a plurality of defects in a particular group 352 in
order to select a representative set of defects from such
group in accordance with one embodiment of the present
invention. Initially, a random defect 354 is selected. Next,
55
60
65
from the initial defect 354 is selected as a representative
defect. As shown, defect 366 is the defect located the farthest
from the initial defect 354. The initial defect 354 is then
thrown out and not used in the representative set (at least
initially). A second defect that is located the farthest distance
from the ?rst representative defect 366 is then selected. In
the illustrated example, defect 368 is the second represen
tative defect.
The next defect which has the maximum minimum of the
two distances to the two representative defects is next
selected as part of the representative set. As shown, defect
360 is located a distance d1 from representative defect 368
and a distance d2 from representative defect 366. Likewise,