1
5.2
Implementation of the Controller
Open a Simulink model called “q_tacho_lead.mdl”. In this model, you will see 2 matching
loops. This will allow you to run the simulation as well as the actual plant simultaneously,
enabling you to note the difference in actual plant performance as opposed to the simulated
plant.
You must now build the model using the WinCon menu. Once it has compiled, you may
Start it using the WinCon server. The SRV-02 should now be tracking the command input.
Plot the Measured Velocity as well as the Setpoint and the Simulated Velocity. This is done
by clicking on the scope button in WinCon and choosing Measured Plant Velocity. Now you
must choose the Setpoint and the Simulated Velocity signals thru the Scope->File>Variables menu.
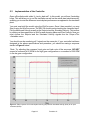
You should now be monitoring all 3 signals on the same plot. If your controller had been
designed to the above specifications and procedure, you should be seeing a response
similar to Figure 4 below.
*Note: Try adjusting the command input gain and take note of the response. DO NOT
exceed a command of 60 RPM for the high gear configuration or a command of 300 RPM
in the low gear configuration.
Figure 4 - Step response of the actual plant velocity (red) and the simulated velocity (blue) to an input
command (black).
Page # 9
Revision: 01