1
Royal Haskoning
•
•
Triwaco User's Manual
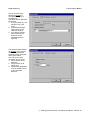
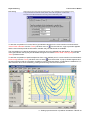
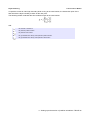
the name of the grid file defining the path-lines' starting points, and
the tracing direction; e.g. Upstream or Downstream tracing or Both ways.
The end time is set by default to a value of 100,000 years (3652500 days).
Note that, more options for influence area calculations are available when the calculation is carried out
interactively in TriPlot. For instance definition of the starting depth.
11.2.6 Response curves
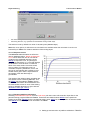
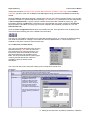
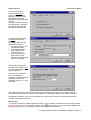
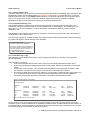
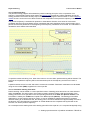
The Influence area calculation set offers the
user an additional option: 'Result as Response
Curve' which allows the user to view the file
containing the calculated response curves:
Infl.rsp. A response curve, or hydrological
response characteristic, is a curve that displays
the distribution of travel times or residence
times of the water, before it reaches a well,
river or polder. The response curve is a
cumulative frequency distribution, that is: the
amount of groundwater with a residence time
smaller than a given value is expressed as a
percentage of the total discharge of
groundwater.
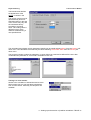
The results of the influence area calculation are
also written to a file containing ado-sets. This
file infl.tro may be loaded in TriPlot. The file
contains the information about destination and
the total residence time for each of the starting
points. A detailed description is given with the
destination codes (par. 10.5.6).
11.2.7 Executing pathline calculations
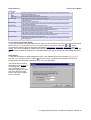
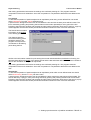
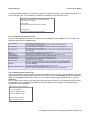
Selecting 'Generate trace input file' from the 'Path-lines' pull-down menu will create four input files for the
particle-tracking program Trace and Trawin. These files have default names well.tri for the path-lines
starting at the wells, trace.tri for the user defined starting point, infl.tri for the computation of influence areas
and inter.tri for interactive path line calculations in TriPlot.
11 Setting up and execution of pathline calculations: TRACE-6