1
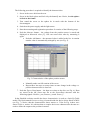
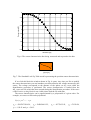
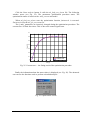
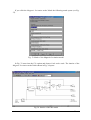
Click the Data analysis button. The collected values of the ball position are displayed
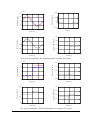
in Fig. 21.
Fig. 21. The sphere motion
The sphere motion is visible. We can locate the cursor at the point slightly before a
position jump occurs (takes place) (see the red line in the picture). We can move the cursor
in two ways: by writing down a value into the edition window or by drugging the slider. In
this way the acquired data are prepared to be analyzed in the next step.
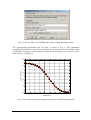
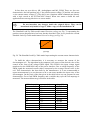
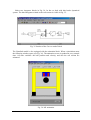
After setting the cursor position, consequently, click the Analyze button. The following
message (see Fig. 22) appears. This information means that the sphere located 15.82 mm
from the electromagnet begins to move toward it when the PWM control over-crosses the
0.49485 duty cycle value.
Fig. 22. Message of the experiment results
MLS User’s Manual
-16-