1
Ch.8
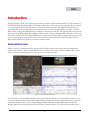
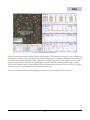
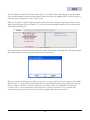
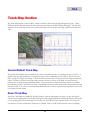
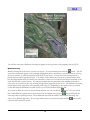
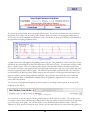
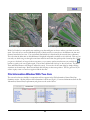
Figure 79 – Two Cars On Track Map
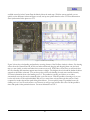
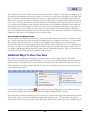
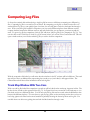
Figure 80 – Two Cars On Track Zoomed In
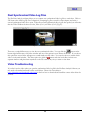
With Car 2 loaded you can quickly start analyzing your data and figure out how to reduce your time out on the
track. Not only can you see the individual lap lines of both cars but you can also see the difference in time and
distance between the two cars. You can instantly find which car is ahead and by how much (time or distance).
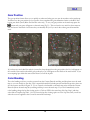
The color that the delta time or delta difference is displayed in depends on which car is in the lead. This way you
can easily see which car goes through a turn faster and how much time they pick up with a better lap line. If one
car gets too far ahead, no longer in the zoom screen, or you want to analyze another turn you can click the
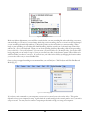
button to synch to two cars together again. The car that is behind will ‘catch up’ to the car in front. The Delta
Time and Delta Distance will change to reflect this synch. You can also do the same thing by simply clicking
anywhere on the track map. Both cars and their data will jump to that exact position. This is a great tool if you
want to replay a turn over and over again to find the best line.
File Information Window With Two Cars
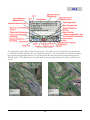
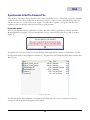
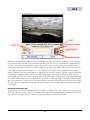
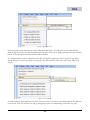
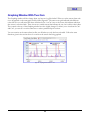
The second car that was loaded for comparison will now appear in the File Information/Sensor Data/Lap
Summary section. All tabs will show the information for both cars (Fig 81). For more information about the File
Information/Sensor Data/Lap Summary tab, please see the section above.
Figure 81 – Current Data Tab With Two Cars
43